Image
Figure Caption

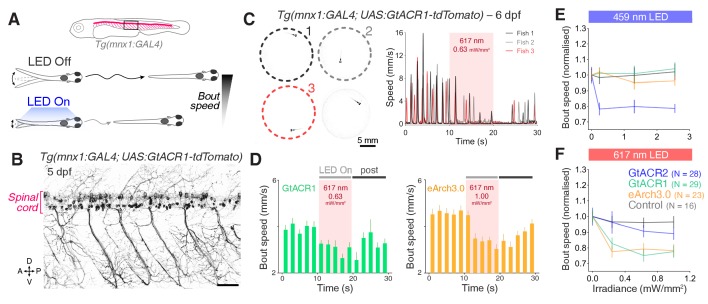
Figure 7—figure supplement 3. Optogenetic suppression of swimming in <italic>Tg(mnx1:GAL4)</italic> larvae.

(A) Schematics of opsin expression pattern and behavioural assay. (B) Opsin expression in spinal motor neurons in a Tg(mnx1:GAL4;UAS:GtACR1-tdTomato) larva at 5 dpf. Imaging field of view corresponds to black box in (A). A, anterior; D, dorsal; P, posterior; V, ventral. Scale bar 50 μm. (C) Background-subtracted camera field of view showing Tg(mnx1:GAL4;UAS:GtACR1-tdTomato) larvae positioned in individual agarose wells (left) and tracking of swimming speed for selected larvae (right). Behaviour was monitored at 50 fps across multiple freely-swimming larvae (6 dpf; N = 24 ± 6 fish per group, mean ± SD) while they were subjected to 10 s light periods (459 or 617 nm, 0–2.55 mW/mm2) with a 50 s inter-stimulus interval. (D) Optogenetically-induced changes in bout rate (mean + SEM, across fish) in Tg(mnx1:GAL4) larvae expressing GtACR1 (N = 29 larvae, left) or eArch3.0 (N = 23 larvae, right). Horizontal grey bars indicate the time windows used for comparative quantification of behavioural changes. Each time bin corresponds to 2 s. (E,F) Normalised bout speed during the `LED On` period in larvae expressing different opsins (mean ± SEM, across fish). Control opsin-negative siblings were subjected to the same light stimuli.

Acknowledgments
This image is the copyrighted work of the attributed author or publisher, and ZFIN has permission only to display this image to its users. Additional permissions should be obtained from the applicable author or publisher of the image. Full text @ Elife