
|
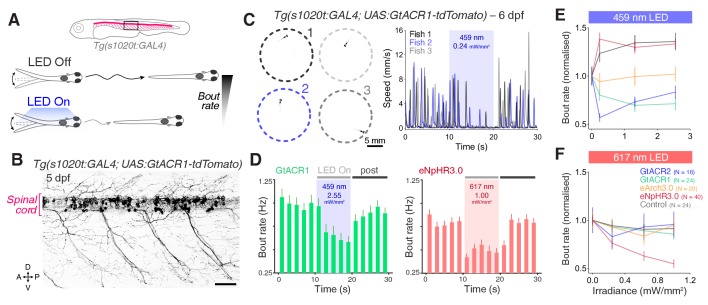
Figure 7 (A) Schematic of behavioural assay. (B) Opsin expression in spinal motor neurons and interneurons in a Tg(s1020t:GAL4;UAS:GtACR1-tdTomato) larva at 5 dpf. Imaging field of view corresponds to black box in (A). A, anterior; D, dorsal; P, posterior; V, ventral. Scale bar 50 μm. (C) Tg(s1020t:GAL4;UAS:GtACR1-tdTomato) larvae were positioned in individual agarose wells (left) and instantaneous swim speed was monitored by centroid tracking (right) at 50 fps (six dpf; N = 25 ± 9 fish per group, mean ± SD). 10 s light periods were delivered (459 or 617 nm, 0–2.55 mW/mm2) with a 50 s inter-stimulus interval. (D) Optogenetically-induced changes in bout rate (mean + SEM, across fish) in Tg(s1020t:GAL4) larvae expressing GtACR1 (N = 24 larvae, left) or eNpHR3.0 (N = 40 larvae, right). Horizontal grey bars indicate the time windows used to quantify behavioural changes. Each time bin corresponds to 2 s. (E,F) Normalised bout rate during the `LED On` period in larvae expressing different opsins (mean ± SEM, across fish) and in control, opsin-negative, siblings. See also Figure 7—figure supplements 1–4 and Figure 7—video 1.