
|
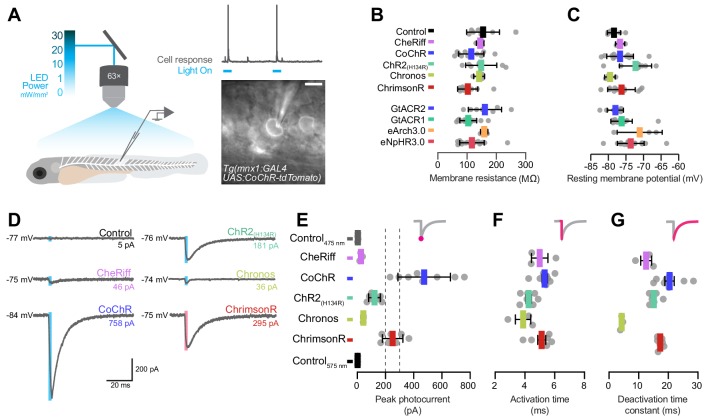
Figure 4 (A) Schematics of experimental setup for optogenetic stimulation with in vivo whole-cell patch clamp recordings. Image shows a patched primary motor neuron (pMN) expressing CoChR in a 6 dpf Tg(mnx1:GAL4;UAS:CoChR-tdTomato) larva. Scale bar 5 μm. (B) Membrane resistance was not affected by opsin expression (mean ± SD, across cells). (C) Resting membrane potential was similar between opsin-expressing and control neurons (mean ± SD). (D) Examples of inward photocurrents in response to 5 ms light pulses (20 mW/mm2). (E) Peak photocurrent amplitude. CoChR and ChrimsonR induced the largest photocurrents (mean ± SEM, across cells). Dotted lines show range of pMN rheobase. Data is pooled across stimulus intensity (1–30 mW/mm2) but see Figure 4—figure supplement 1 for currents at varying irradiance. (F) Photocurrent activation time was similar across opsins (mean ± SEM). (G) Chronos photocurrents had the fastest deactivation time constant, while CoChR and ChrimsonR showed similar deactivation kinetics (mean ± SEM). See also Figure 4—figure supplement 1.