
|
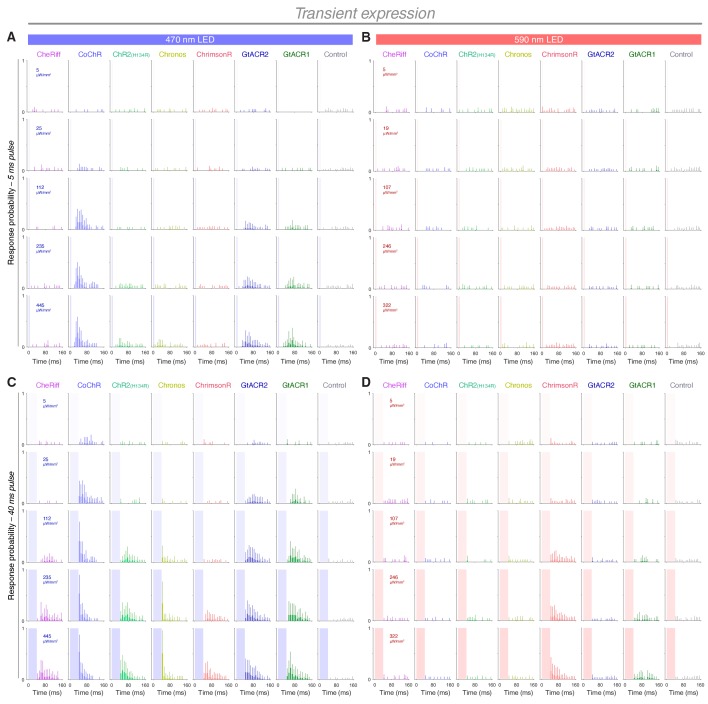
Figure 2 (A) Experimental setup for optogenetic stimulation and behavioural monitoring. IR, infrared. (B) Schematic of behavioural assay. (C) Opsin expression in trigeminal neurons in a Tg(isl2b:GAL4;UAS:CoChR-tdTomato) embryo at 1 dpf. Imaging field of view corresponds to black box in (B). A, anterior; D, dorsal; P, posterior; V, ventral. Scale bar 50 μm. (D) Tg(isl2b:GAL4;UAS:CoChR-tdTomato) embryos positioned in individual agarose wells. Behaviour was monitored at 1000 frames per second across multiple embryos (28–30 hpf; N = 69 ± 26 fish per opsin group, mean ± SD) subjected to 5 or 40 ms pulses of full-field illumination (470 or 590 nm, 4.5–445 μW/mm2) with a 15 s inter-stimulus interval. (E) Optogenetically-triggered escape responses detected from ΔPixel traces in the three embryos indicated in (D). Dotted line indicates maximum latency (200 ms) for a response to be considered optogenetically-triggered. (F,G) Response probability for transient (E) or stable (F) transgenic embryos expressing different opsins (mean ± SEM, across fish). Insets show response latency for 5 ms blue light pulses in CoChR-expressing embryos (median ± 95% CI, across fish). See also Figure 2—figure supplements 1 and 2 and Figure 2—video 1.