IMAGE

Figure 3

ID
ZDB-IMAGE-200421-75
Genes
Source
Figures for Sensi et al., 2020
Image
Figure Caption

Figure 3

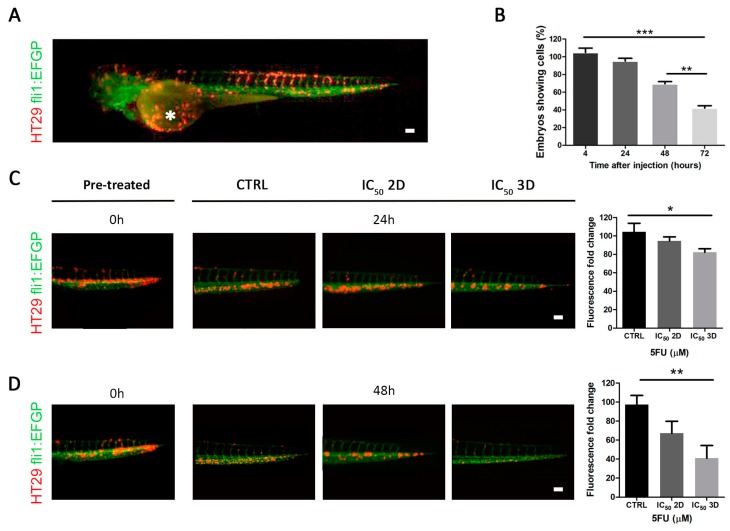
Effect of 5FU treatment on in vivo zebrafish model. (A) Tg(fli1:EGFP) zebrafish embryo (with green fluorescent vessels) xenotransplantated with Dil marked HT29 cells (red), injected into the duct of Cuvier (white asterisk). (B) The monitoring of zebrafish embryos showed viable cells after 24-48-72 h post-injection. (C) Analysis of Dil+ HT29 injected cells in zebrafish embryos, pre-treatment (time 0), after 24 h of treatment with DMSO (control group), IC50 2D, IC50 3D, and relative quantifications (scale bar = 100 µm). (D) Analysis of Dil+ HT29 injected cells in zebrafish embryos, pre-treatment (time 0), after 48 h of treatment with DMSO (control group), IC50 2D, IC50 3D, and relative quantifications (scale bar = 100 µm) (* p-value < 0.05; ** p-value < 0.01; *** p-value < 0.001).

Figure Data
Acknowledgments
This image is the copyrighted work of the attributed author or publisher, and ZFIN has permission only to display this image to its users. Additional permissions should be obtained from the applicable author or publisher of the image. Full text @ Cancers