IMAGE

Figure 3

ID
ZDB-IMAGE-200421-37
Source
Figures for Valenti et al., 2020
Image
Figure Caption

Figure 3

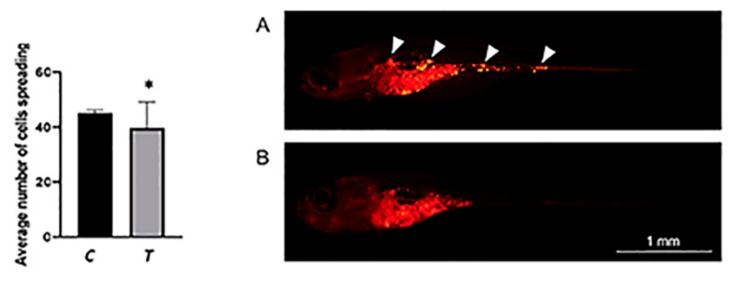
The number of cells spreading was lower in BEL β-trefoil-treated zebrafish (T: n45) compared to controls (C: n38) (p < 0.05). Representative images show untreated (A) and BEL β-trefoil-treated (B) zebrafish. At 7 dpi, initial metastases (indicated by white arrowheads) are detectable in untreated zebrafish, while most cells are still in the yolk area of treated zebrafish. *P < 0.05; Magnification 20X.

Acknowledgments
This image is the copyrighted work of the attributed author or publisher, and ZFIN has permission only to display this image to its users. Additional permissions should be obtained from the applicable author or publisher of the image. Full text @ Molecules