IMAGE

Figure 1

ID
ZDB-IMAGE-200421-26
Source
Figures for Valenti et al., 2020
Image
Figure Caption

Figure 1

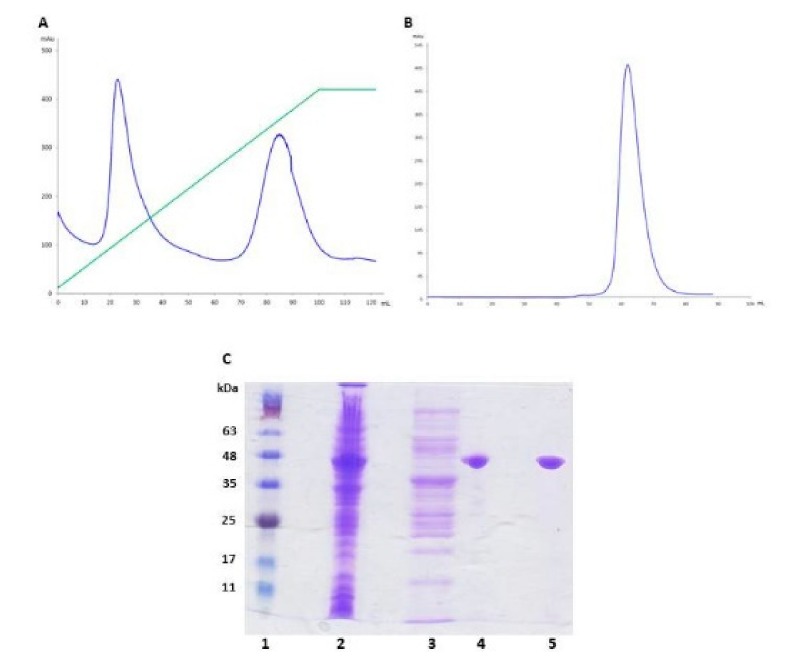
Fluorescent BEL β-trefoil purification. (A) Elution profile of fluorescent BEL β-trefoil on the IMAC column. The blue line refers to the protein elution followed spectrophotometrically at 280 nm; the green line represents the increase in the imidazole concentration along the gradient. (B) Elution profile of fluorescent BEL β-trefoil on the G75 gel filtration column, recorded at 280 nm. (C) SDS-PAGE (12%). Lane 1: molecular mass markers (BlueRay Prestained Protein Marker, Jena Bioscience); lane 2: crude extract from bacteria; lane 3: first peak from the IMAC column, corresponding to nonspecific proteins; lane 4: second peak from the IMAC column, corresponding to the fluorescent BEL β-trefoil; lane 5: pure fluorescent BEL β-trefoil present in the main peak of the G75 chromatography.

Acknowledgments
This image is the copyrighted work of the attributed author or publisher, and ZFIN has permission only to display this image to its users. Additional permissions should be obtained from the applicable author or publisher of the image. Full text @ Molecules