
|
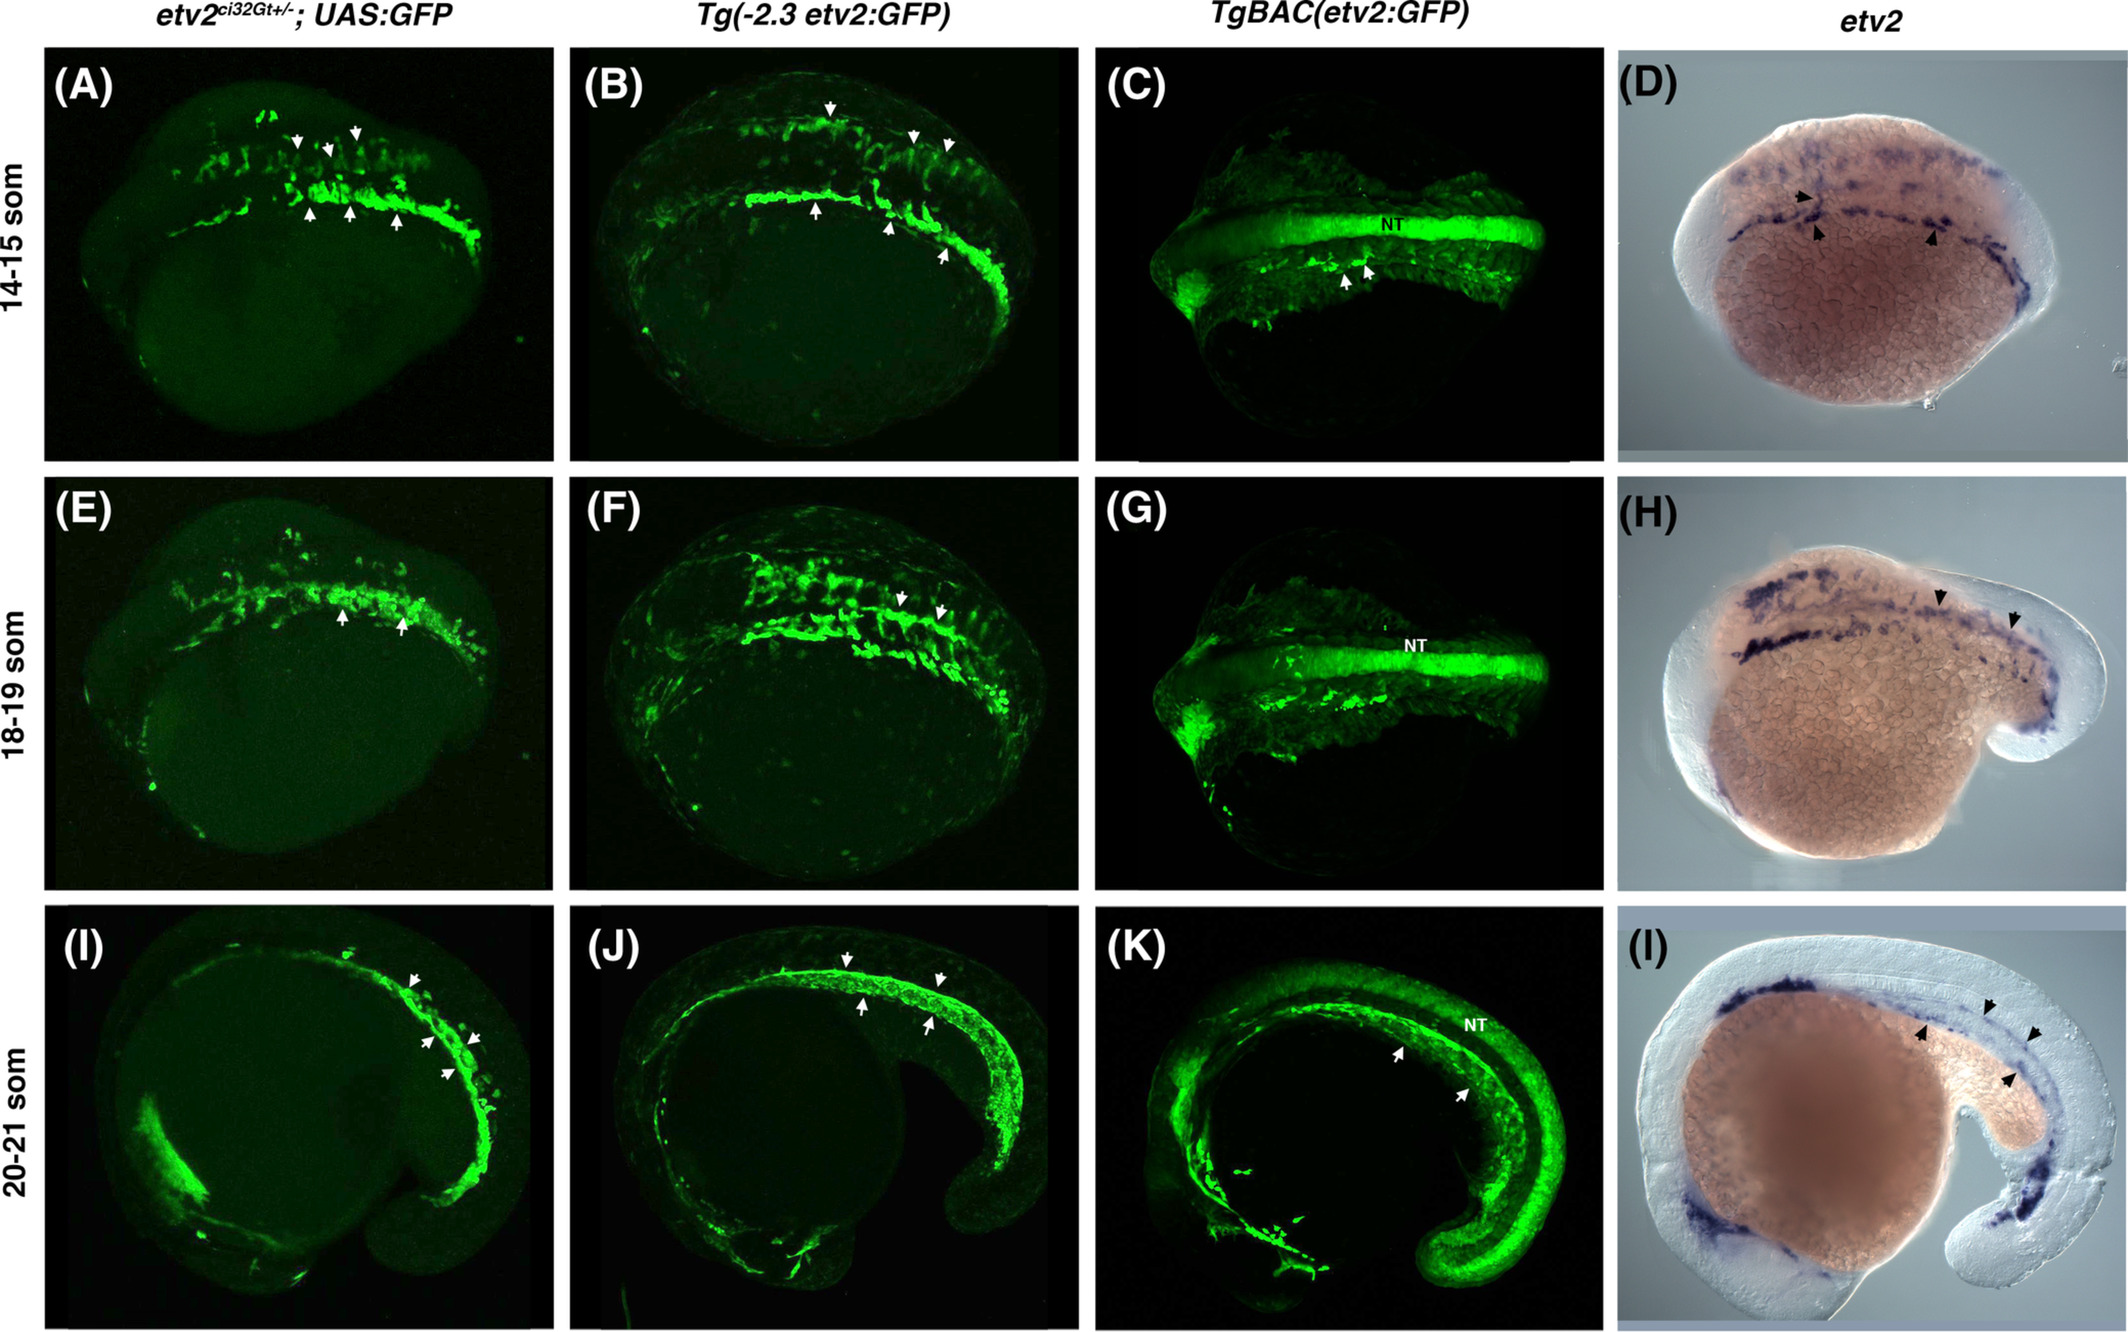
Fig. 3 A comparison of etv2 ci32Gt+/−; UAS:GFP, Tg(−2.3etv2:GFP), TgBAC(etv2:GFP) fluorescence pattern and etv2 mRNA expression analyzed by in situ hybridization (ISH) at the 14‐21 somite stages. A‐C, GFP fluorescence or, D, etv2 mRNA expression is apparent in bilaterally located vascular endothelial progenitors which have started migrating toward the midline at the 14‐15‐somite stages (arrowheads). Strong nonspecific GFP expression in the neural tube (NT) is apparent in TgBAC(etv2:GFP) embryos. E‐H, GFP‐positive vascular endothelial progenitors at the 18‐19‐somite stages are coalescing at the midline into vascular cords (arrowheads, E,F). Similar etv2 expression pattern is observed by ISH analysis, H. I‐L, GFP expression at the 20‐21‐somite stages is apparent in the forming axial vasculature (arrowheads), and nonspecific expression is apparent in the neural tube, K. Similar etv2 expression pattern is apparent from ISH analysis, L. A‐H, dorsal or dorsolateral view; I‐L, lateral view, anterior is to the left