
|
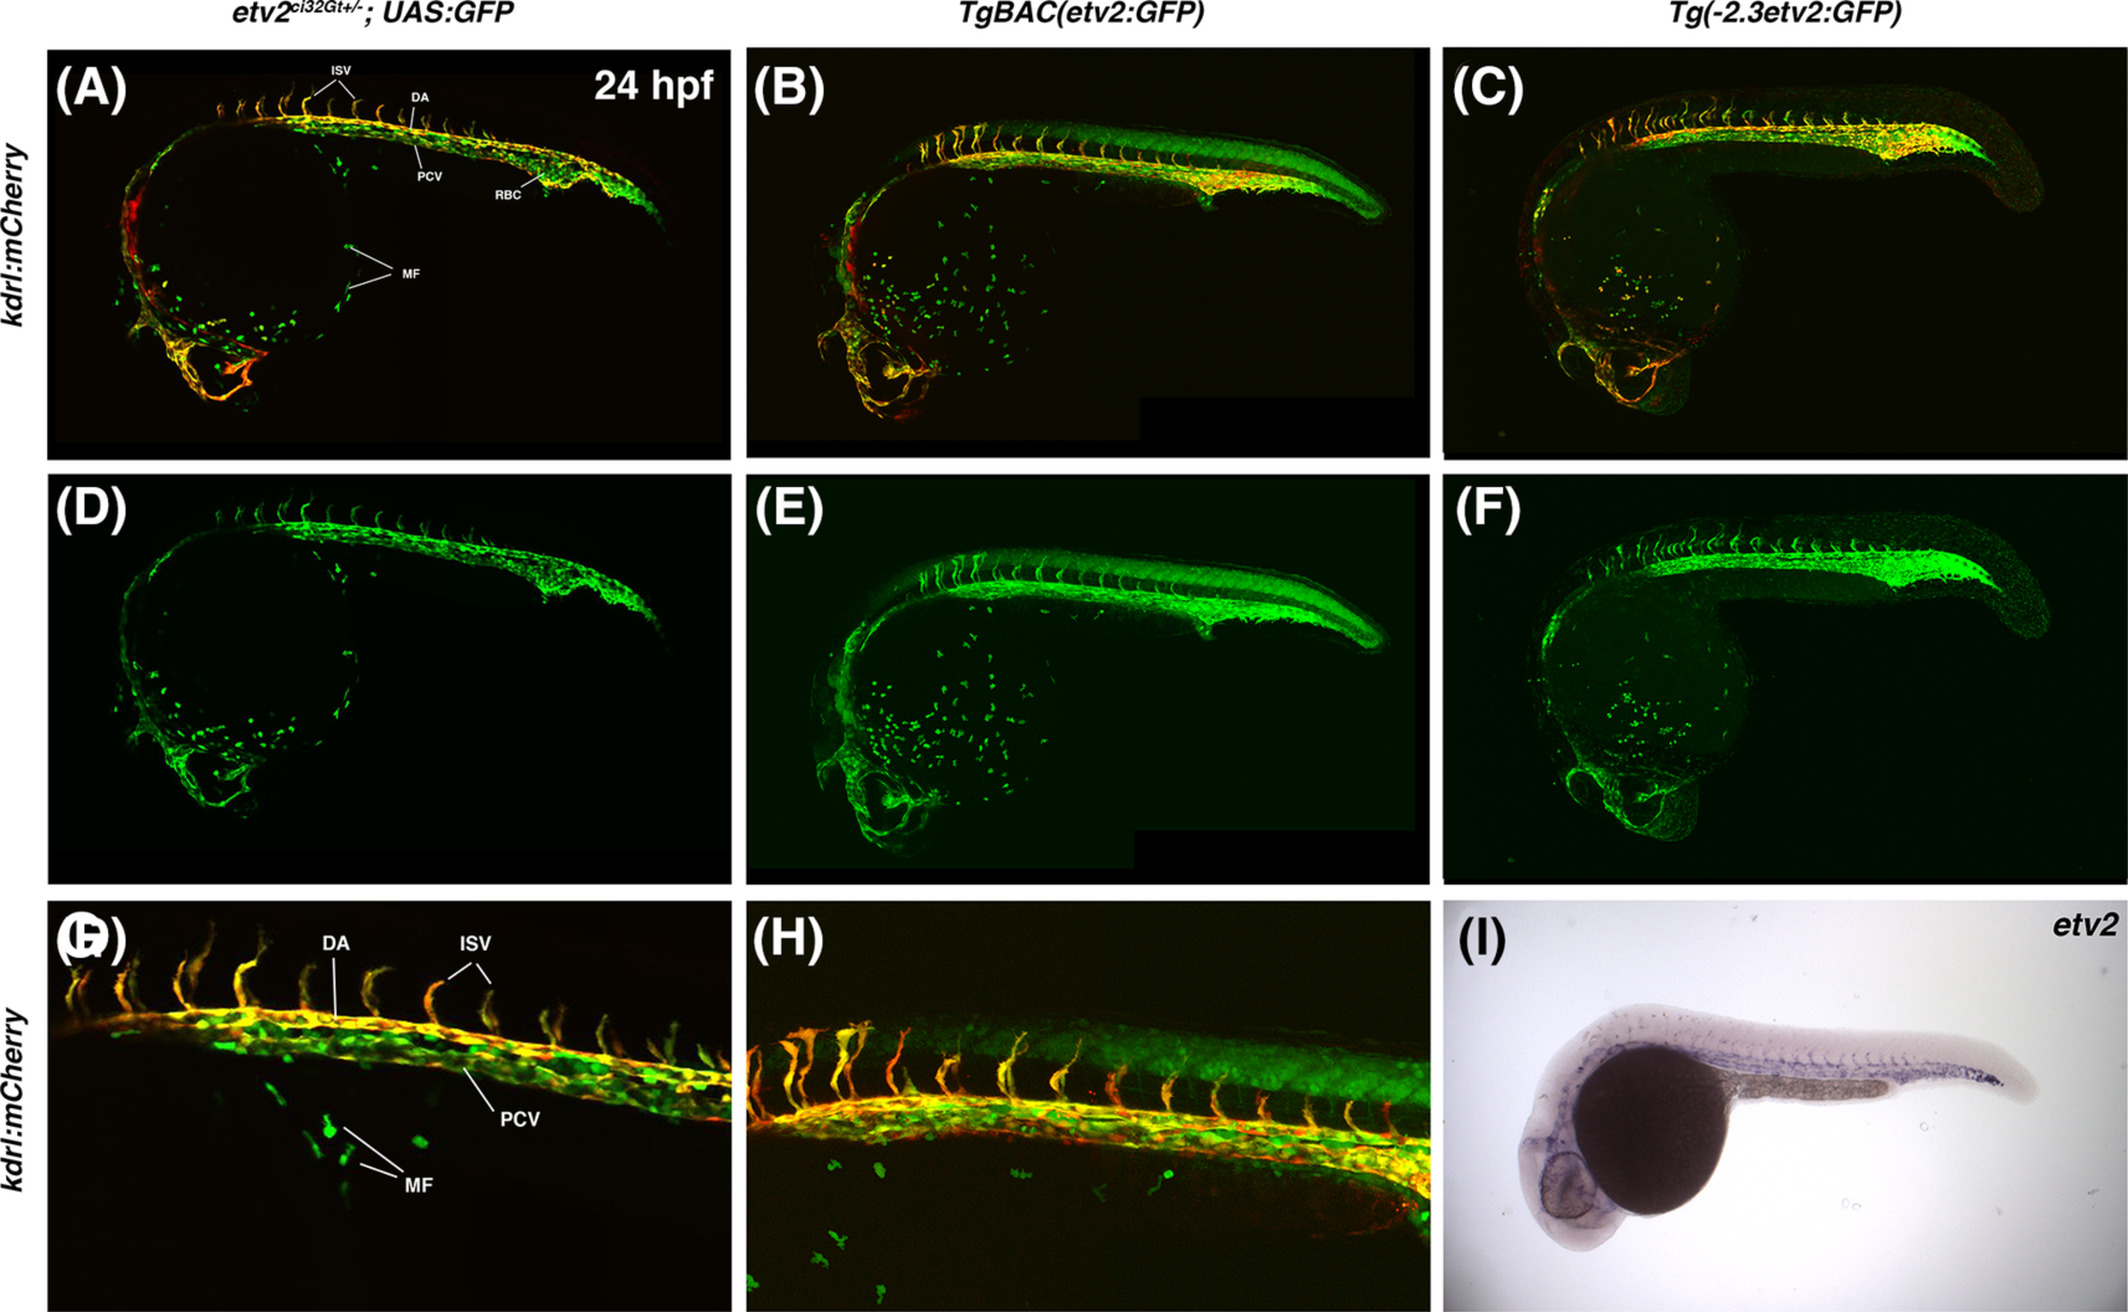
Fig. 4 A comparison of etv2 ci32Gt+/−; UAS:GFP, TgBAC(etv2:GFP), Tg(−2.3etv2:GFP) fluorescence pattern (in kdrl:mCherry background, top row) and etv2 mRNA expression analyzed by in situ hybridization (ISH) at 24 hpf. etv2 ci32Gt+/−; UAS:GFP expression is apparent throughout the entire vasculature, red blood cells (RBC), and macrophages (MF). TgBAC(etv2:GFP) shows similar expression pattern, and also shows nonspecific expression in the neural tube. A‐C, Merged mCherry and GFP channels; D‐F, GFP channel; G,H, magnified images of the trunk region in, A and B. I, ISH analysis for etv2 mRNA expression at 24 hpf. DA, dorsal aorta; PCV, posterior cardinal vein; ISV, intersegmental vessels