IMAGE

Fig. 3

ID
ZDB-IMAGE-200409-10
Source
Figures for Gawel et al., 2019
Image
Figure Caption

Fig. 3

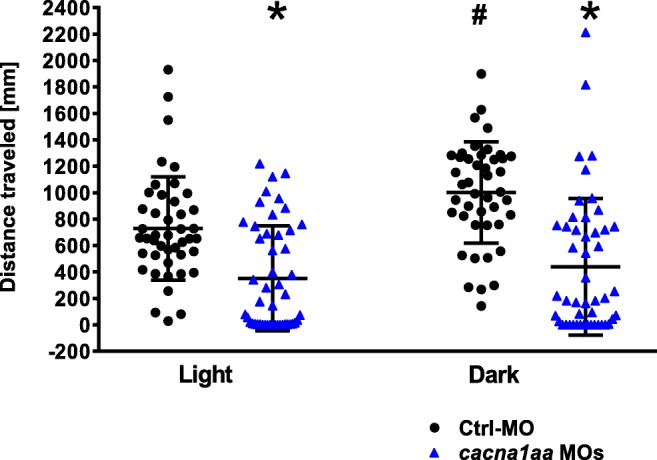
Locomotor activity of 4 dpf cacna1aa and Ctrl-MO larvae. Larvae were habituated to the apparatus 20 min (10 min light, 10 min in dark) before experiment, and total locomotor activity was tracked within 10 min. The data were pooled from 2 independent experiments. The results were analyzed using one-way ANOVA, followed by Tukey’s post-hoc test. Dots represent individual measurements, the central horizontal mark is the mean, and error bars represent standard deviation (SD) (n = 44–48/group). *P < 0.05 vs Ctrl-MO group in relevant phase, #P < 0.05 vs Ctrl-MO group in light phase. Dpf, days post-fertilization

Figure Data
Acknowledgments
This image is the copyrighted work of the attributed author or publisher, and ZFIN has permission only to display this image to its users. Additional permissions should be obtained from the applicable author or publisher of the image. Full text @ Mol. Neurobiol.