IMAGE

FIGURE 9

ID
ZDB-IMAGE-200406-78
Source
Figures for Mashkaryan et al., 2020
Image
Figure Caption

FIGURE 9

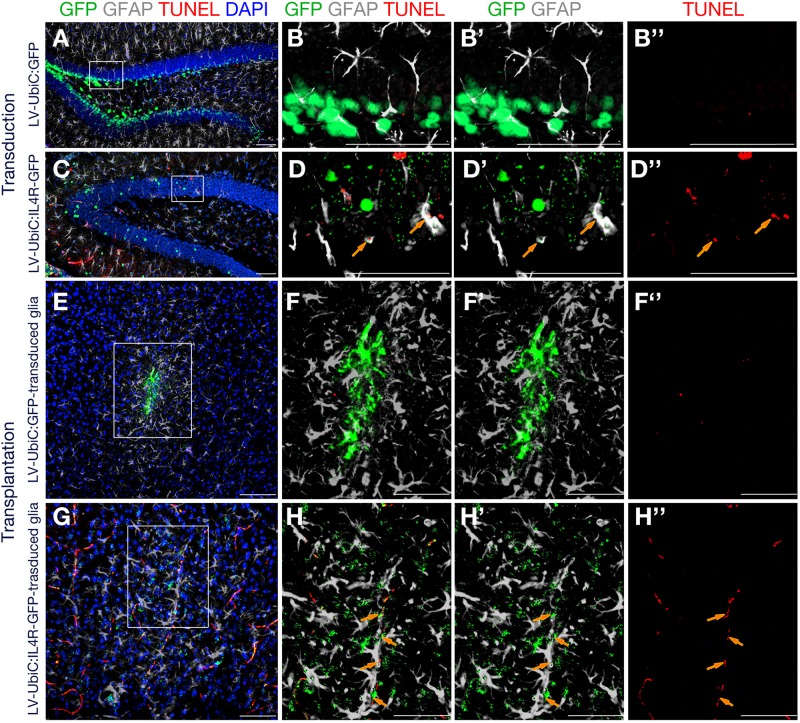
Immunostaining for GFAP (gray) and GFP (green) coupled to TUNEL staining (red). (A) Wild type mouse hippocampus transduced with Lv-UbiC:GFP. (B) Higher magnification of the framed region in (A) without DAPI. (B′) Overlaid GFP and GFAP channels. (B′′) TUNEL staining as single fluorescence channel. (C) Wild type mouse hippocampus transduced with Lv-UbiC:IL4R-GFP. (D) Higher magnification of the framed region in (D) without DAPI. (D′) Overlaid GFP and GFAP channels. (D′′) TUNEL staining as single fluorescence channel. (E) Wild type mouse cortex transplanted with Lv-UbiC:GFP-transduced astroglia. (F) Higher magnification of the framed region in (E) without DAPI. (F′) Overlaid GFP and GFAP channels. (F′′) TUNEL staining as single fluorescence channel. (G) Wild type mouse cortex transplanted with Lv-UbiC:IL4R-GFP-transduced astroglia. (H) Higher magnification of the framed region in (G) without DAPI. (H′) Overlaid GFP and GFAP channels. (H′′) TUNEL staining as single fluorescence channel. Orange arrows show TUNEL-positive, transduced glia. All animals are WT. n ≥ 3 wild type animals. Scale bars: 100 μm.

Acknowledgments
This image is the copyrighted work of the attributed author or publisher, and ZFIN has permission only to display this image to its users. Additional permissions should be obtained from the applicable author or publisher of the image. Full text @ Front Cell Dev Biol