
|
Figure 2
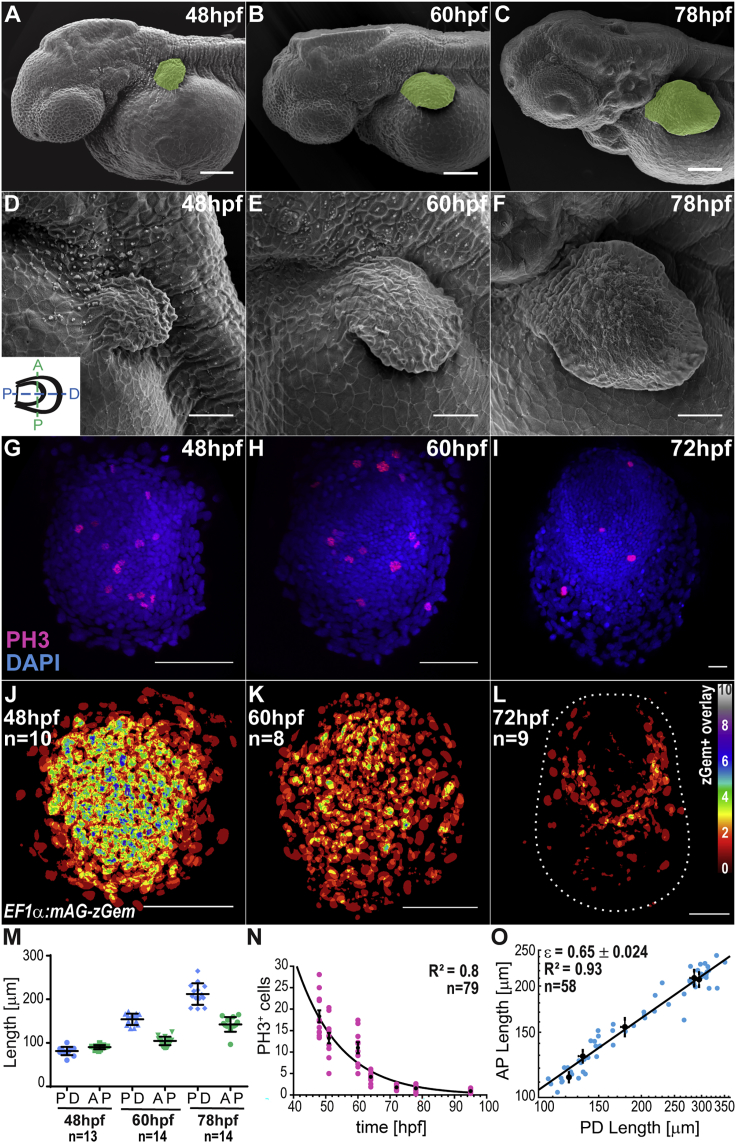
Pectoral Fin Growth
(A–F) Scanning electron micrographs of larvae (A–C) and fins (D–F) at different times. Cartoon indicates fin orientation.
(G–I) DAPI (blue) and Phospho-histoneH3 immunostainings (red) at different times.
(J–L) Overlay of fins expressing zGeminin. LUT shows number of overlaid zGeminin+ nuclei per pixel. Dashed line, fin boundary. Distal, down; anterior, left.
(M) PD and AP fin lengths from SEM images.
(N) Number of phospho-histoneH3 cells per 10,000 μm2 at different times. Line, exponential fit with goodness of fit (R2).
(O) Log-log plot of AP versus PD lengths to determine anisotropy
Black dots, average from developmental time bins. Mean ± SEM are shown in all graphs. n represents total number of fins analyzed/overlaid. Scale bars, 100 μm (A–C), 50 μm (D–L).