
|
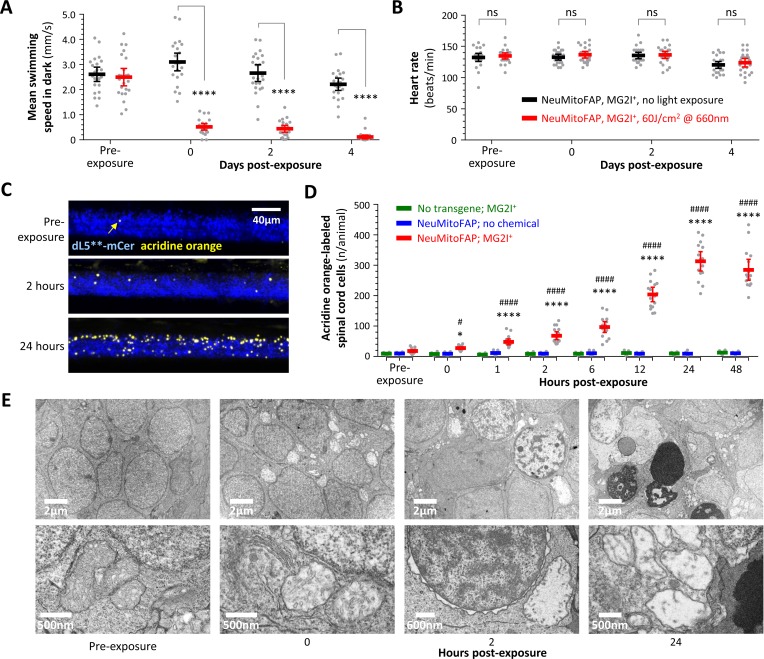
Figure 6
Persistent neurological deficits and cell death in NeuMitoFAP zebrafish exposed to MG2I and far-red light.
(A) Mean swimming speed of NeuMitoFAP zebrafish treated with MG2I was quantified during the dark phase of the visual motor response (y-axis) after exposure to 60 J/cm2 far-red light (red) or no exposure (black). Data points show responses of individual zebrafish before light exposure and afterwards at the time points indicated (x-axis). Bars show group mean ± 95% CI. ****p<0.0001, 2-way ANOVA with Šidák multiple comparisons test. (B) Heart rate (y-axis) was quantified in the same experimental groups and time points as panel A. Data points show heart rates of individual zebrafish, bars show group mean ± 95% CI. (C) Degenerating cells in MG2I-treated NeuMitoFAP zebrafish were labeled with acridine orange, before, and 2 and 24 hr after exposure to 60 J/cm2 far-red light. The images show confocal z-plane projections through the spinal cord of immobilized live zebrafish larvae. dL5**-mCerulean3 is pseudocolored blue and acridine orange-labeled cells yellow. (D) Acridine orange-labeled cells in the spinal cord of live zebrafish were counted (y-axis), before far-red light exposure and at the indicated time points afterwards (x-axis). Experimental groups: WT zebrafish treated with MG2I (green), NeuMitoFAP zebrafish (blue), NeuMitoFAP zebrafish treated with MG2I (red). Data points show individual zebrafish, bars show mean ± SE. *p<0.05, ****p<0.0001, NeuMitoFAP-MG2I zebrafish versus other groups at the same time point; #p<0.05, ####p<0.0001, NeuMitoFAP-MG2I zebrafish at the indicated time point versus pre-exposure value; 2-way ANOVA with Tukey multiple comparisons test. (E) Transmission electron micrographs of sections from the telencephalon of NeuMitoFAP zebrafish treated with MG2I before, and at the indicated time points after, far-red light exposure. The upper image of each pair shows a low-magnification view, and the lower image shows a high-magnification view illustrating ultrastructural features.