
|
Figure 1
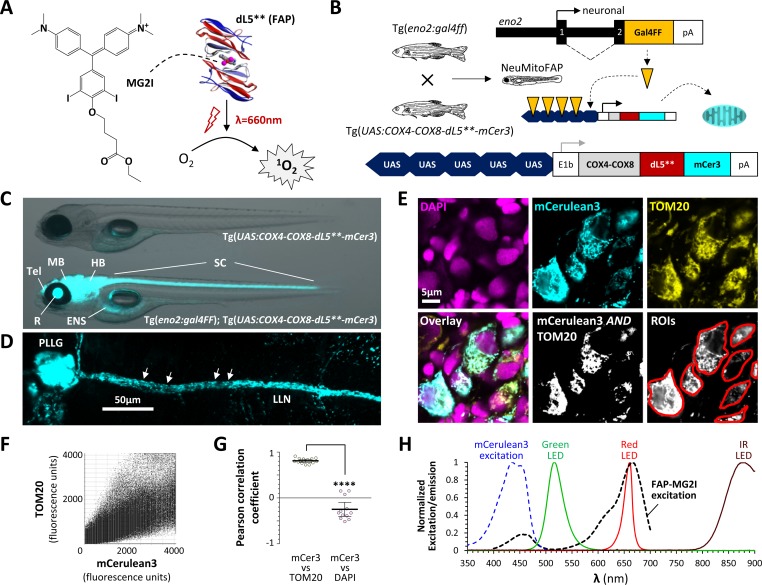
Generation of NeuMitoFAP zebrafish.
(A) When the fluorogen MG2I (chemical structure shown on left) is bound to the fluorogen-activating protein (FAP) dL5** (right), excitation by far-red light causes generation of singlet oxygen. (B) Diagrams of transgene constructs eno2:gal4FF (above) and UAS:COX4-COX8-dL5**-mCer3 (below). Transactivation of the UAS enhancer by Gal4 in the neurons of double transgenic Tg(eno2:gal4ff); Tg(UAS:COX4-COX8-dL5**-mCer3) ‘NeuMitoFAP’ zebrafish results in expression of the dL5**-mCerulean3 fusion protein in the mitochondrial matrix. (C) Merged phase contrast and mCerulean3 epifluorescence images, showing live Tg(UAS:COX4-COX8-dL5**-mCer3) (above) and Tg(eno2:gal4ff); Tg(UAS:COX4-COX8-dL5**-mCer3) (NeuMitoFAP; below) zebrafish larvae at 5 days post-fertilization. mCerulean3-expressing structures are labeled (Tel, telencephalon; MB, midbrain; HB, hindbrain; SC, spinal cord; R, retina, ENS enteric nervous system). (D) Confocal z-plane projection showing mCerulean3 expression in the posterior lateral line ganglion (PLLG) and lateral line nerve (LLN) of a NeuMitoFAP zebrafish. Individual axonal mitochondria are indicated (arrows). (E) Brain sections from NeuMitoFAP zebrafish were labeled for nuclei (DAPI; magenta), dL5**-mCerulean3 (cyan) and mitochondria (TOM20; yellow). Single confocal planes of the individual channels are shown in the upper row. The lower row shows: the three channels overlaid; the output of a Boolean (mCerulean3 AND TOM20) map; and representative regions of interest that were analyzed in panels F and G. (F) Scatter plot of TOM20 signal (y-axis) versus mCerulean3 signal (x-axis) in each pixel within regions of interest. (G) Pearson correlation coefficient of signal intensity for mCerulean3 versus TOM20 (left) compared with mCerulean3 versus DAPI (right). Each data point shows a region of interest corresponding to an individual mCerulean3-expressing cell, bars show mean ± SE; ****p<0.0001, 2-tailed t-test. (H) Normalized excitation and emission spectra of the fluorophores and light sources used in this study.