IMAGE

Figure 5

ID
ZDB-IMAGE-200406-244
Source
Figures for Gao et al., 2020
Image
Figure Caption

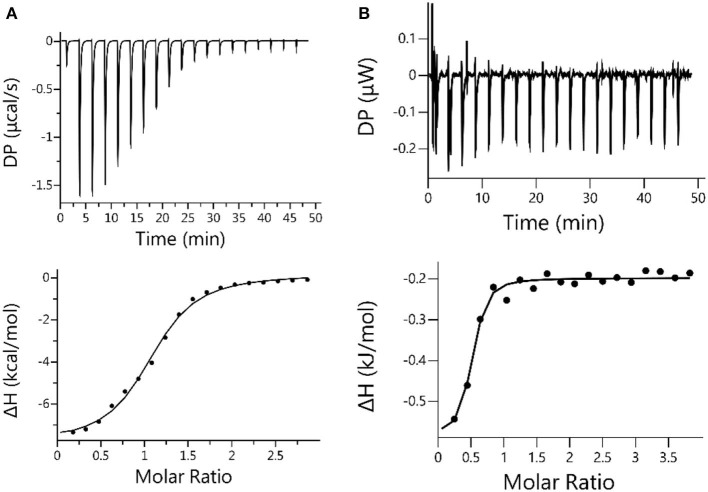
Figure 5

(A) Microcalorimetric measurements of ANA when titrated with CB[7] in water at room temperature. Top: Evolved thermogram during the titration. Bottom: Plot of ΔH against the molar ratio between CB[7] and ANA during the titration, with the best fit by using the “one set of binding sites” binding mode; (B) Microcalorimetric measurements of ANA when titrated with β-CD in water at room temperature. Top: Evolved thermogram of during the titration. Bottom: Plot of ΔH against the molar ratio between β-CD and ANA, with the best fit by using the “one set of binding sites” binding mode.

Acknowledgments
This image is the copyrighted work of the attributed author or publisher, and ZFIN has permission only to display this image to its users. Additional permissions should be obtained from the applicable author or publisher of the image. Full text @ Front Chem