IMAGE

Figure 3

ID
ZDB-IMAGE-200406-242
Source
Figures for Gao et al., 2020
Image
Figure Caption

Figure 3

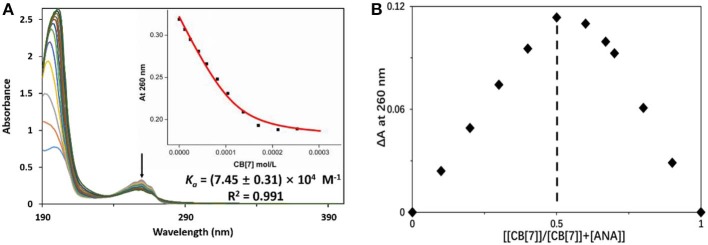
(A) UV-vis measurements of ANA (50 μM) in the presence of increasing concentration of CB[7] (up to 250 μM) in aqueous solution (pH = 7). Inset: the fitting curve of the titration data at 260 nm; (B) Job's plot of ANA@CB[7] system (with [ANA]+[CB[7]] = 50 μM) based on a continuous variation titration in aqueous solutions (pH = 7).

Acknowledgments
This image is the copyrighted work of the attributed author or publisher, and ZFIN has permission only to display this image to its users. Additional permissions should be obtained from the applicable author or publisher of the image. Full text @ Front Chem