
Image
|
Figure Caption
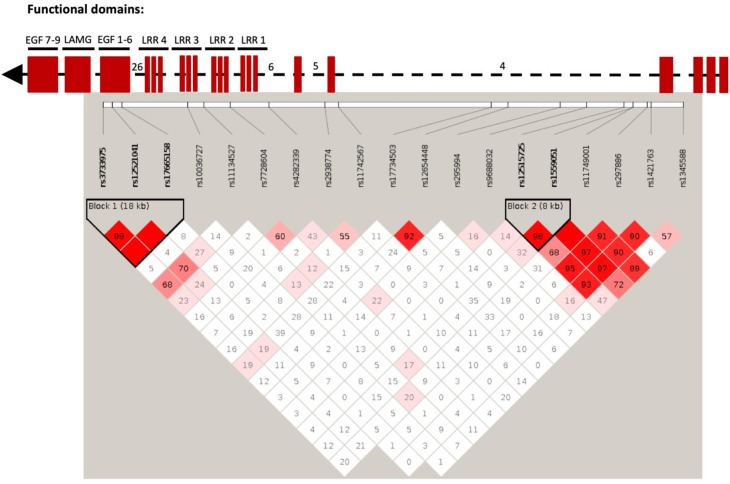
Figure 9.
Numbers within each square indicate D’ values (white: D’<1, LOD <2; blue: D’=1, LOD <2; pink: D’<1, LOD ≥2; and bright red: D’=1, LOD ≥2). Top part of the figure shows domain organization of the SLIT protein based on the UCSC Genome Browser (
Acknowledgments
This image is the copyrighted work of the attributed author or publisher, and
ZFIN has permission only to display this image to its users.
Additional permissions should be obtained from the applicable author or publisher of the image.
Full text @ Elife