IMAGE

Fig. 5

ID
ZDB-IMAGE-200406-22
Source
Figures for Zhang et al., 2020
Image
Figure Caption

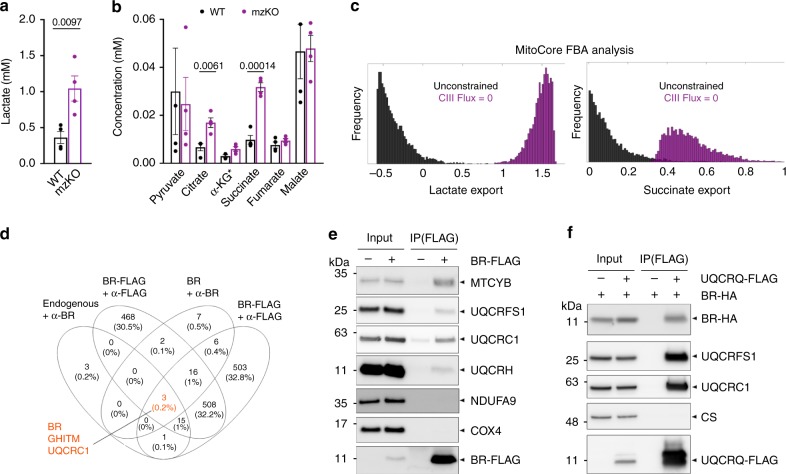
Fig. 5 Br functionally and physically interacts with electron transport chain complex III.

a Lactate concentrations in 5 dpf WT and mzKO larvae. Data represent mean and SEM of four independent clutches each with 50 larvae per genotype. p-values from two-sided paired t-test. b Citric acid cycle organic acid concentrations in 5 dpf WT and mzKO larvae. Data represent mean and SEM of four independent clutches each with 50 larvae per genotype. p-values from two-sided paired t-test with Bonferroni correction. *α-KG concentrations are a 10-fold multiple to enable visualization on the same scale. c Distributions of the export rate of lactate and succinate (5000 flux samples) comparing the unconstrained MitoCore model versus the CIII-blocked model derived by MitoCore flux balance analysis (FBA). d Venn diagram depicting intersections of proteins identified in 4 co-IP/mass spec experiments of BR in HEK293T mitochondria. Endogenous BR and overexpressed untagged BR were immunoprecipitated with α-BR, overexpressed BR-FLAG with α-FLAG. e Immunoprecipitation of BR-FLAG followed by immunoblotting for indicated ETC proteins from mouse mitochondria with AAV9-mediated expression of BR-FLAG. MTCYB, UQCRFS1, UQCRC1, and UQCRH are components of CIII. NDUFA9 and COX4 are components of CI and CIV, respectively. f. Reciprocal IP of BR with CIII components. UQCRQ-FLAG and BR-HA were co-transfected into HEK293T. UQCRQ-FLAG immunoprecipitation was followed by immunoblotting for BR-HA and indicated proteins. CS is an unrelated matrix protein.

Figure Data
Acknowledgments
This image is the copyrighted work of the attributed author or publisher, and ZFIN has permission only to display this image to its users. Additional permissions should be obtained from the applicable author or publisher of the image. Full text @ Nat. Commun.