IMAGE

Figure 2

ID
ZDB-IMAGE-200406-205
Source
Figures for Bui Thi et al., 2020
Image
Figure Caption

Figure 2

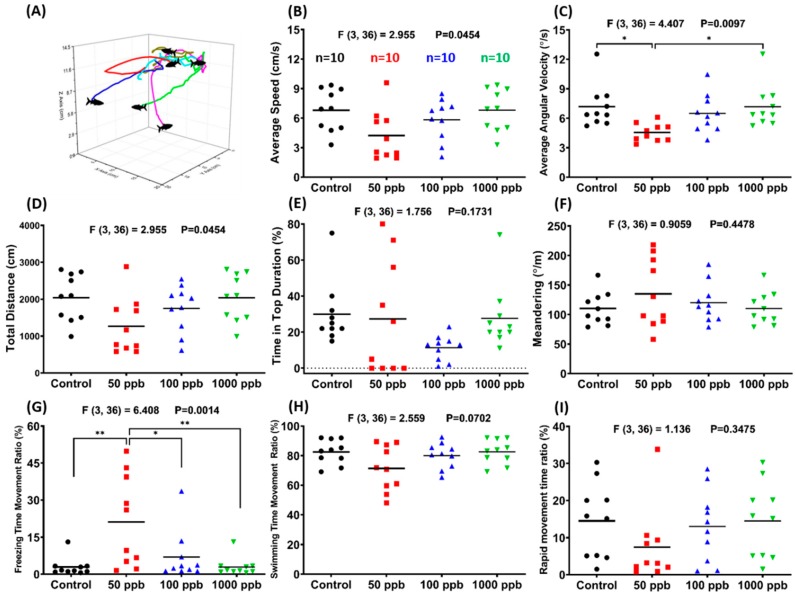
Comparison of three-dimensional (3D) behavior among seven-day PbCl2-exposed groups and a control group. (A) A schematic diagram showing the typical 3D locomotor paths of several individual fish, using our previously established method. Eight parameters were measured among treatments and a control group: (B) average speed, (C) average angular velocity, (D) total distance, (E) time in top duration, (F) meandering, (G) freezing time movement ratio, (H) swimming time movement ratio, and (I) rapid movement time ratio. Data are expressed in mean values evaluated by one-way ANOVA (n = 10; * p ≤ 0.05, and ** p ≤ 0.01).

Acknowledgments
This image is the copyrighted work of the attributed author or publisher, and ZFIN has permission only to display this image to its users. Additional permissions should be obtained from the applicable author or publisher of the image. Full text @ Int. J. Mol. Sci.