IMAGE

Fig. 6

ID
ZDB-IMAGE-200406-195
Source
Figures for Pei et al., 2020
Image
Figure Caption

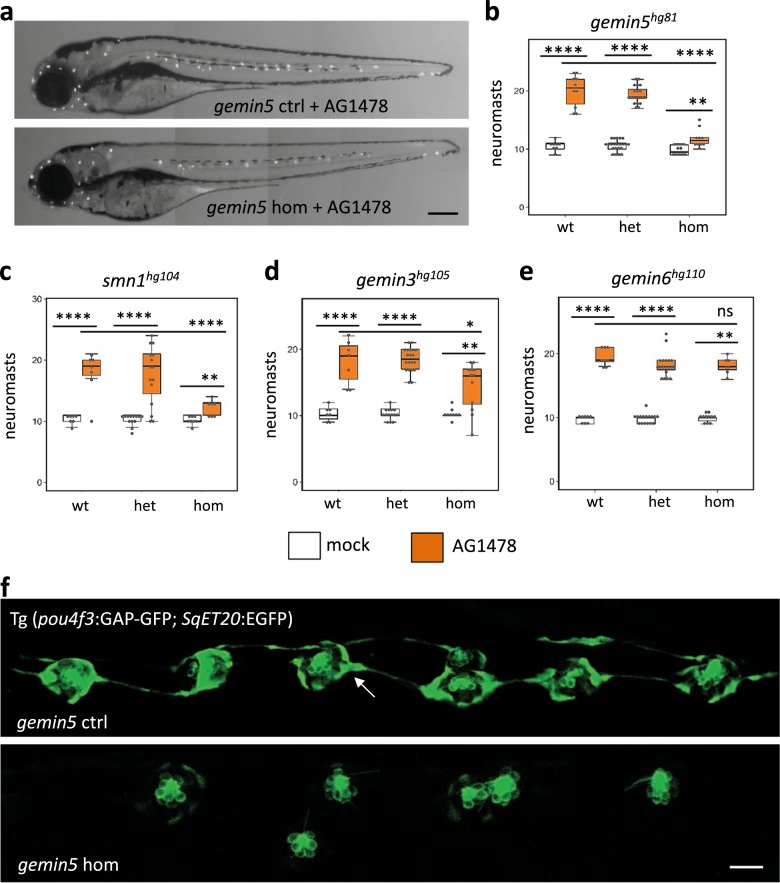
Fig. 6 Reduced responsiveness of <italic>gemin3</italic>, <italic>gemin5</italic>, and <italic>smn1</italic> mutants to ErbB pathway inhibitor AG1478.

a Neuromasts in AG1478-treated control and gemin5hg81 mutant embryos at 5 dpf. Neuromasts are shown as white dots. Scale bar, 250 µm. b Quantification of the lateral line neuromasts in mock and AG1478-treated embryos carrying the gemin5hg81 mutation at 5 dpf. c Quantification of the lateral line neuromasts in mock and AG1478-treated embryos carrying the smn1hg104 mutation at 5 dpf. d Quantification of the lateral line neuromasts in mock and AG1478-treated embryos carrying the gemin3hg105 mutation at 5 dpf. e Quantification of the lateral line neuromasts in mock and AG1478-treated embryos carrying the gemin6hg110 mutation at 5 dpf. Error bars in the graphs show the mean ± s.e.m. ns, P > 0.05; *P < 0.05; **P < 0.01; ****P < 0.0001. f Fluorescent images of lateral line neuromasts labeled by transgenes Tg(pou4f3:GAP-GFP) and Tg(SqET20:EGFP) in the control and gemin5hg81 mutant at 5 dpf after AG1478 treatment. Images were taken in the areas surrounding the end of yolk extension. White arrow points to the Tg(SqET20:EGFP) signal in the control embryo, which is dramatically increased in the mutant. Scale bar, 50 µm. The embryos used for the above analyses were generated from a pairwise incross of heterozygotic parents, treated with 2 µM AG1478 from 1 to 5 dpf, and then used Yopro-1 staining or transgenic fluorescence at 5 dpf to analyze neuromast formation. Data for each condition were generated using ~40 embryos born from a single pair of heterozygous parents.

Figure Data
Acknowledgments
This image is the copyrighted work of the attributed author or publisher, and ZFIN has permission only to display this image to its users. Additional permissions should be obtained from the applicable author or publisher of the image. Full text @ NPJ Regen Med