IMAGE

Fig. 1

ID
ZDB-IMAGE-200406-16
Source
Figures for Zhang et al., 2020
Image
Figure Caption

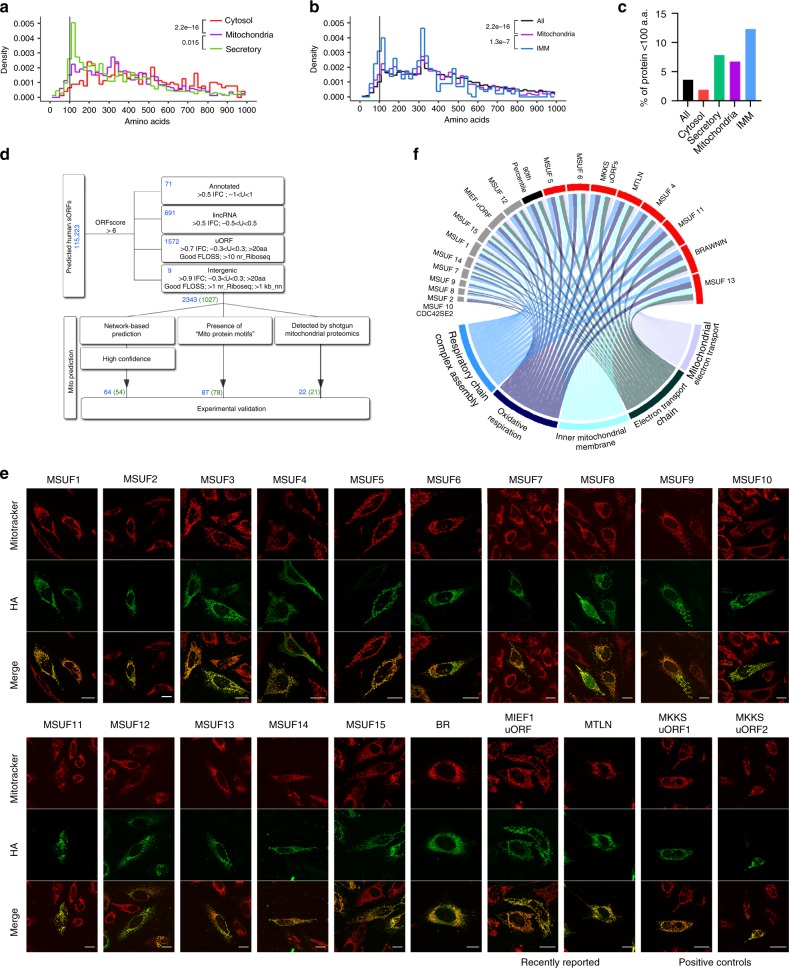
Fig. 1 Mito-SEP prediction pipeline identifies uncharacterized endogenous mitochondrial SEPs.

a Size distribution of curated human proteins annotated as mitochondria (1172 proteins), cytosolic (5806 proteins), or secretory (3351 proteins) on Uniprot. p-value by two-sided Mann–Whitney U-test. n.s. = not significant. b Size distribution of Uniprot proteins (All) (20417 proteins) annotated to reside in mitochondria (1172 proteins) or inner mitochondrial membrane (IMM) (292 proteins). p-value by two-sided Mann–Whitney U-test. c Percentage of proteins smaller than 100 a.a. in different cellular localizations. d Human SEP selection and mitochondrial prediction workflow. Blue numbers indicate number of SEPs and green numbers indicate number of genes encoding these SEPs. e HA immunofluorescence (green) of mito-SEP candidates showing colocalization with Mitotracker Red (red) in HeLa cells. Uncharacterized SEPs are labeled as mitochondrial SEP with unknown function (MSUF). Scale = 20 μM. f Circular plot of expression correlation between MSUF and MSigDB gene ontology (GO) gene sets that relate to oxidative phosphorylation. The width of each connector represents the normalized enrichment score (NES) value of the gene set enrichment analysis (GSEA) analysis performed on a ranked list of MSUF-coexpressed genes determined by weighted gene co-expression network analysis (WGCNA). The black bar indicates the score of the 90th percentile of the score of 1000 randomly selected genes. CDC42SE2 depicts the position of a non-mitochondrial negative control with NES = 0.

Acknowledgments
This image is the copyrighted work of the attributed author or publisher, and ZFIN has permission only to display this image to its users. Additional permissions should be obtained from the applicable author or publisher of the image. Full text @ Nat. Commun.