IMAGE

Figure 2

ID
ZDB-IMAGE-200406-105
Source
Figures for Landin et al., 2020
Image
Figure Caption

Figure 2

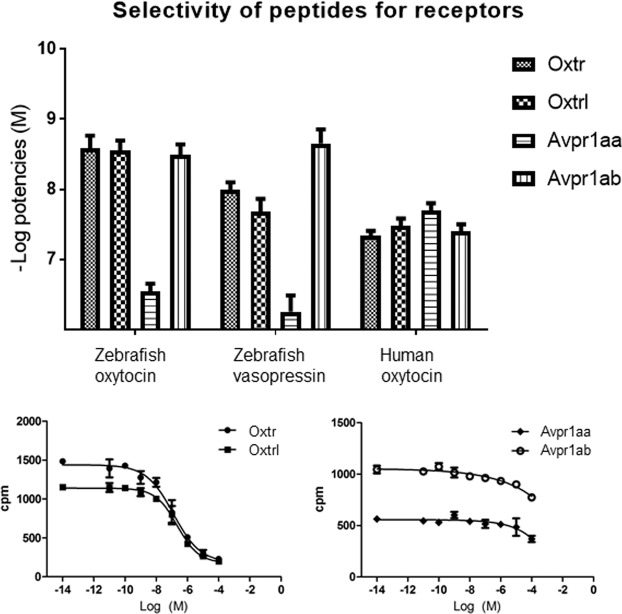
(a) Potencies (pEC50 values) of zebrafish oxytocin (zOT), zebrafish vasopressin (zVP) and human oxytocin at zebrafish OT (Oxtr and Oxtrl) and VP receptors (Avpr1aa and Avpr1ab). For p-values, see Results section. (b) L-368,899 dose-response curves for Oxtr, Oxtrl, Avpr1aa, Avpr1ab stimulated by zVP. cpm = counts per minute.

Acknowledgments
This image is the copyrighted work of the attributed author or publisher, and ZFIN has permission only to display this image to its users. Additional permissions should be obtained from the applicable author or publisher of the image. Full text @ Sci. Rep.