
|
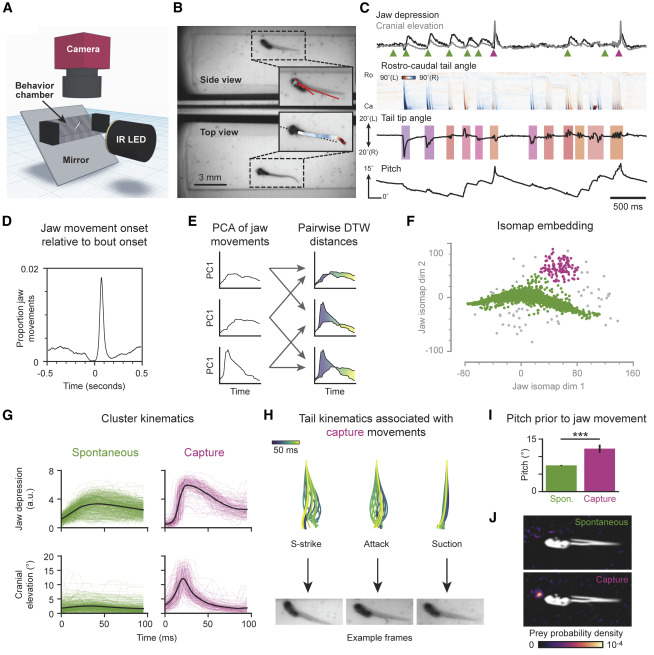
Fig. 6 Larvae Capture Prey from Below with Stereotyped Jaw Kinematics (A) Schematic of the setup used to record behavior simultaneously from above and from the side. (B) Example frame; insets are overlaid with tail and jaw tracking. (C) Jaw and tail kinematics from 4 s of behavioral recording. Top: depression of the jaw (black) and elevation of the cranium (gray). Arrowheads: jaw movement onsets. Spontaneous movements (green); capture strikes (magenta). Middle: tail tracking. Bouts color-coded according to nearest exemplar in behavioral space. Bottom: pitch of the fish. (D) Cross-correlation between bout onsets and jaw movement onsets. (E) Generating a jaw movement behavioral space. Jaw movements projected onto first PC followed by pairwise alignment and distance calculation with DTW. (F) Two-dimensional isomap embedding of DTW distances between jaw movements. Clustered using HDBSCAN into spontaneous jaw movements (green), capture jaw movements (magenta), and noise (gray). (G) Jaw depression (top) and cranial elevation (bottom) for spontaneous (left) and capture (right) jaw movements. Colored traces: individual movements. Black lines: average. (H) Example tail movements (top) preceding the shown capture jaw movement (bottom). (I) Pitch of fish prior to bouts containing spontaneous and capture jaw movements (∗∗∗two-tailed p < 0.001, unpaired Student’s t test). Mean ± SEM. (J) Prey probability density prior to bouts containing spontaneous (top) and capture (bottom) jaw movements. White: average outline of fish. Anterior is left. See also Videos S6 and S7.