
|
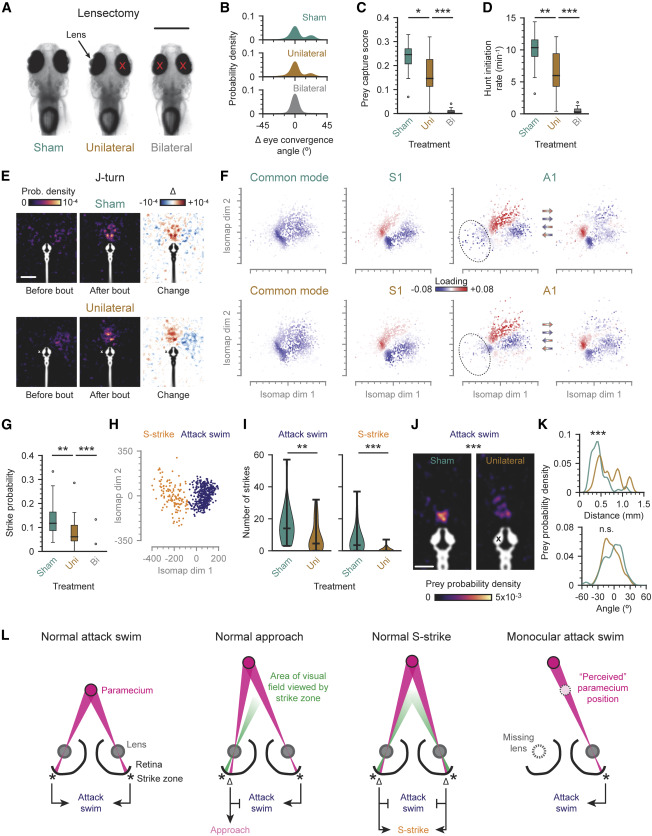
Fig. 7 Larvae Use Binocular Cues to Position Prey on the Strike Zone (A) Lensectomy. Lens dissected from one (unilateral) or both (bilateral) eyes (red crosses). Scale bar, 500 μm. (B) Eye convergence distributions in sham, unilaterally, and bilaterally delensed larvae. Aligned to the resting eye convergence angle (0°). (C) Proportion of time spent engaged in prey capture (prey capture score) for each treatment group. (D) Number of times animals converged their eyes each minute (hunt initiation rate) for each treatment group. (E) Stimulus maps for sham and unilaterally delensed animals during J-turns. Animals that had their right lens removed are mirrored (white cross). Scale bar, 1 mm. (F) Transition modes of sham (top) and unilaterally delensed (bottom) animals. Differences between common modes not significant (p > 0.05). Differences between S1 and A1: p < 0.05, permutation test on absolute cosine similarity. Dotted outline: approximate location of capture strikes in the space. (G) Probability that hunting sequences terminate with a capture strike for animals in each treatment group. (H) Capture strike sub-space, generated as outlined in Figure 5B. Capture strikes clustered into two types using K-means clustering. Attack swims (blue). S-strikes (orange). (I) Number of strikes performed by animals split by strike type (attack swim versus S-strike) and treatment group (sham versus unilateral). (J) Prey probability density at the onset of attack swims in sham (left) and unilaterally delensed (right) animals. Cross indicates eye with lens removed (right animals mirrored). Scale bar, 500 μm. (K) Prey probability densities prior to attack swims at various distances (top) and azimuthal angles (bottom) in the visual field for sham and unilaterally delensed animals. Positive angles signify azimuthal position toward the sighted eye. (L) Model for the binocular control of capture strikes. Far left: a paramecium falling on the strike zone triggers an attack swim. Center left: a paramecium falling outside the strike zone triggers an approach. Center right: a paramecium centered in the visual field but outside the strike zone triggers an S-strike. Far right: a paramecium falling outside the strike zone in a larva with its left lens removed (gray dotted outline) triggers an inappropriate attack swim. Δ signifies offset between current prey position (magenta) and strike zone (asterisk/green cone). (C), (D), (G), and (I): ∗p < 0.05, ∗∗p < 0.01, ∗∗∗p < 0.001; Mann-Whitney U test. (J) and (K): ∗∗∗p < 0.001; n.s., not significant (p = 0.15), permutation test on energy distances between distributions. See also Video S8.