
|
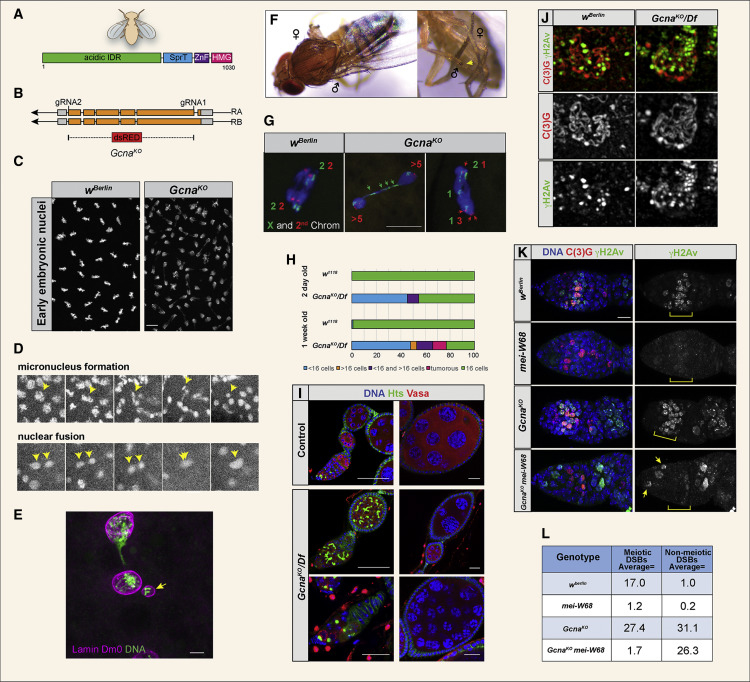
Fig. 1 Loss of Gcna Results in Chromosome Instability in Drosophila (A) Domain organization of the Drosophila Gcna protein. (B) Drosophila Gcna gene locus showing the two isoforms and design of the GcnaKO allele with insertion of a dsRED cassette. UTRs in gray, exons in orange. (C) DAPI staining of control (wBerlin) and GcnaKO (maternal null) embryos reveals mitotic defects caused by loss of maternal Gcna. Scale bar represents 10 μM. (D) Still images from movies of GcnaKO maternal-null embryos carrying a HistoneH2Av-mRFP transgene to visualize chromosomes. Yellow arrowheads indicate micronucleus formation (top) and nuclear fusion event (bottom). (E) Early Gcna maternal mutant Drosophila embryo stained for Lamin Dm0 (magenta) and DNA (green) to show that a nuclear envelope forms around a micronucleus (yellow arrow). Scale bar represents 5 μm. (F) Gynandromorph phenotypes in progeny of GcnaKO females. Left, note the line of dark and light pigmentation bisecting the thorax, reflecting the presence or absence of the yellow marker carried on one of the X chromosomes. Right, sex combs are seen on one forelimb (yellow arrow) but are missing from the other, reflecting adoption of male and female fates respectively. (G) Embryonic nuclei from control (wBerlin) and GcnaKO mutant females were labeled with FISH probes to the X (green) and second (red) chromosomes. The green and red numbers refer to number of X and second chromosome-specific foci observed in each half of the dividing nuclei. Controls show chromosomes dividing equally into daughter cells. GcnaKO cells have aberrant chromosome numbers and lagging chromosomes (green arrows). Scale bar represents 5 μm. (H and I) Quantification (H) and corresponding images (I) of Drosophila ovarian phenotypes. Hts marks the fusome; Vasa marks germ cells. Control (w1118) ovarioles contain the expected 16-cell cysts. GcnaKO/Df ovarioles have many cysts with abnormal numbers of cells, as well as tumors. The frequency of these phenotypes worsens with age. Scale bars represent 20 μm. (J) SIM images of wBerlin and GcnaKO mutant meiotic nuclei stained for synaptonemal complex marker C(3)G (red) and DNA damage marker γH2Av (green). (K) wBerlin, GcnaKO, mei-W860949, and GcnaKO; mei-W680949 ovarioles stained for C(3)G (red), γH2Av (green), and DNA (DAPI, blue). Scale bar represents 10 μm. (L) Average number of γH2Av labeled foci per nucleus in the indicated genotypes. Ten meiotic and non-meiotic nuclei were examined per genotype.
Reprinted from Developmental Cell, 52(1), Bhargava, V., Goldstein, C.D., Russell, L., Xu, L., Ahmed, M., Li, W., Casey, A., Servage, K., Kollipara, R., Picciarelli, Z., Kittler, R., Yatsenko, A., Carmell, M., Orth, K., Amatruda, J.F., Yanowitz, J.L., Buszczak, M., GCNA Preserves Genome Integrity and Fertility Across Species, 38-52.e10, Copyright (2019) with permission from Elsevier. Full text @ Dev. Cell