
|
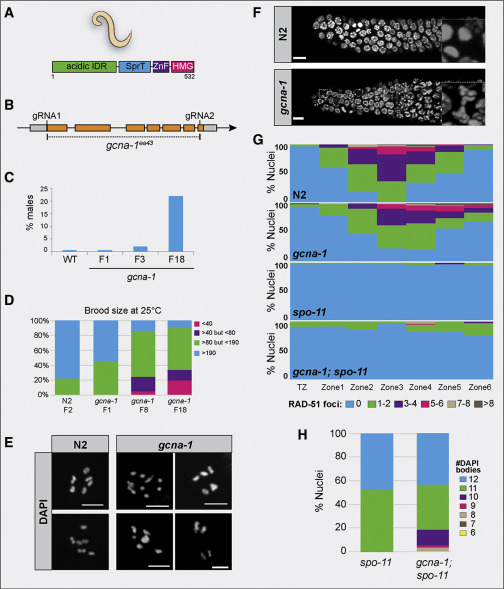
Fig. 2 Loss of gcna-1 Results in Genomic Instability in C. elegans (A) Domain structure of C. elegans GCNA-1 protein. (B) The C. elegans gcna-1 locus detailing the design of the gcna-1(ea43) allele. (C) The HIM phenotype increases over generations (n = 12 parental worms for N2 (wild-type control) and n = 21, 21, and 34 for gcna-1 F1, F3, and F18, respectively). (D) gcna-1 mutant worms exhibit decreases in brood size with successive passaging (n = 12 parental worms for wild type, and 34 each for gcna-1 F1, F8, and F18). (E) DAPI staining of diakinesis nuclei from control (N2, wild type) and gcna-1 mutants. Controls showed the expected 6 DAPI+ bivalents; gcna-1 mutant nuclei contained mixtures of bivalents, univalents, and fused chromosomes. Scale bars represent 5 μm. (F) Mitotic germ cells from gcna-1 mutants exhibit chromosome bridges as seen by DAPI-stained DNA. Insets are examples of nuclei in anaphase. Scale bars represent 5 μm. (G) Quantification of meiotic (leptotene through onset of diplotene) RAD-51 foci in N2, gcna-1, spo-11, and gcna-1;spo-11 mutant C. elegans germ lines (n = 3 germlines/genotype). (H) Quantification of DAPI positive bodies in diakinesis-stage, -1 oocytes of C. elegans (spo-11, n = 20; gcna-1;spo-11, n = 42).
Reprinted from Developmental Cell, 52(1), Bhargava, V., Goldstein, C.D., Russell, L., Xu, L., Ahmed, M., Li, W., Casey, A., Servage, K., Kollipara, R., Picciarelli, Z., Kittler, R., Yatsenko, A., Carmell, M., Orth, K., Amatruda, J.F., Yanowitz, J.L., Buszczak, M., GCNA Preserves Genome Integrity and Fertility Across Species, 38-52.e10, Copyright (2019) with permission from Elsevier. Full text @ Dev. Cell