
|
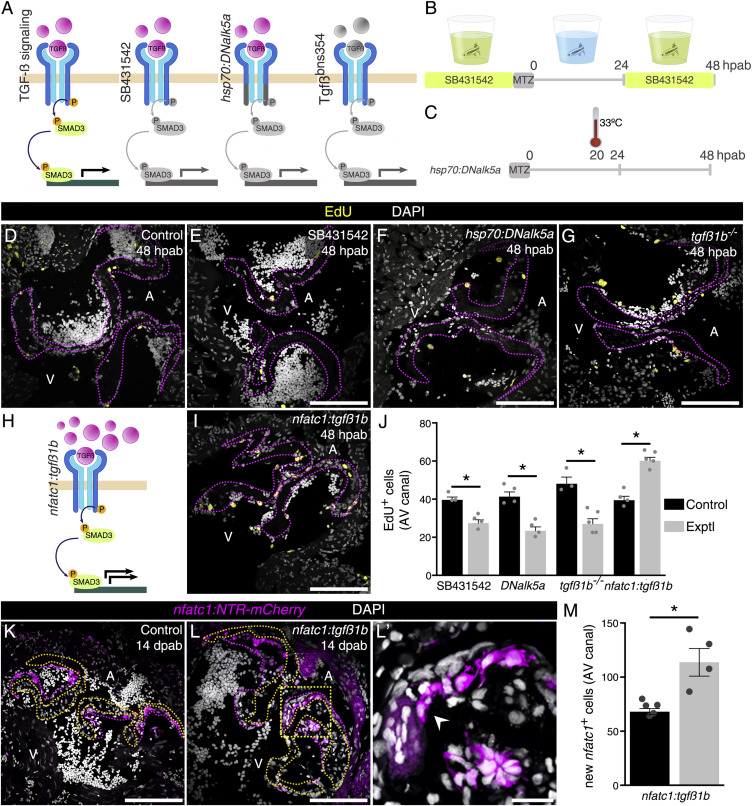
Fig. 4 Manipulation of TGF-β Signaling Alters Cell Cycle Re-entry and Differentiation into nfatc1+ Cells during Cardiac Valve Regeneration (A) Schematics of the impact of the inhibition tools on TGF-β signaling (gray color indicates absence of phosphorylation of, and by, the receptor). (B and C) Schematics of the drug (B) and heat-shock (C) treatments. (D–G) EdU detection at 48 hpab in control samples (D), after SB431542 treatment (E), after overexpression of DNalk5a (F), and in tgfß1b mutants (G). (H and I) Schematics (H) and EdU detection (I) after tgfß1b overexpression. Pink dashed lines delineate the old valve leaflets. (J) Quantification of EdU+ cells after TGF-β signaling manipulation. (K–L′) Characterization of new valve cell differentiation at 14 dpab in control (K) and after tgfß1b overexpression (L and L′). Arrowhead points to new nfatc1+ cells. Boxed area shown in (L′). Yellow and pink dashed lines delineate the old and new valve leaflets, respectively. (M) Quantification of new nfatc1+ valve cells at 14 dpab. Plot values represent means ± SEM. (∗p < 0.05 by Mann Whitney test) A, atrium; V, ventricle; Exptl, experimental. Scale bars: (D–G), (I), (K), (L) 100 μm; (L′) 20 μm. See also Figures S3 and S4.
Reprinted from Developmental Cell, 52(1), Bensimon-Brito, A., Ramkumar, S., Boezio, G.L.M., Guenther, S., Kuenne, C., Helker, C.S.M., Sánchez-Iranzo, H., Iloska, D., Piesker, J., Pullamsetti, S., Mercader, N., Beis, D., Stainier, D.Y.R., TGF-β Signaling Promotes Tissue Formation during Cardiac Valve Regeneration in Adult Zebrafish, 9-20.e7, Copyright (2019) with permission from Elsevier. Full text @ Dev. Cell