
|
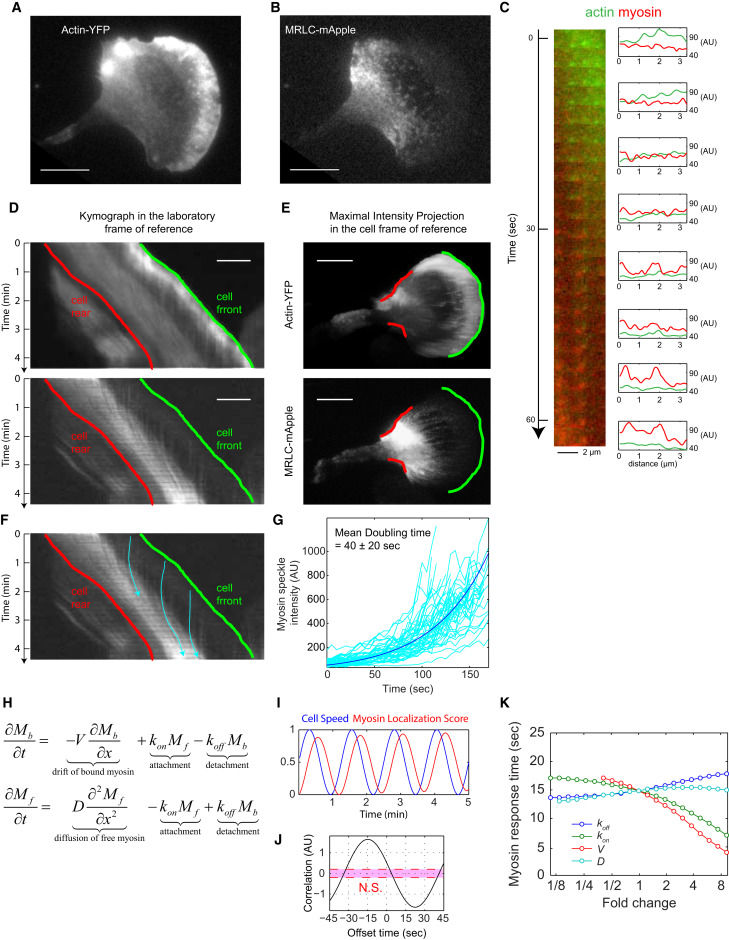
Fig. 2 MRLC Retrograde Flow and Membrane Retraction Facilitate the Rapid Coupling between Protrusion and Myosin II Redistribution (A and B) TIRF images of (A) actin-YFP and (B) MRLC-mApple, coexpressed in an HL60 cell. The images are representative of 20 different cells. Scale bars in (A), (B), (D), and (E) represent 10 μm. (C) A magnified image sequence showing the transition from actin puncta to myosin puncta. The image at the left is a montage of the same region in the laboratory frame of reference over a 63-s period. The diagrams at the right show the fluorescence intensity of line scans from the corresponding image at the left. In the lab frame of reference, the actin and myosin puncta at the front of the cell remain static relative to the substrate. (D) Kymographs of actin-YFP (top) and MRLC-mApple (bottom) in the lab frame of reference. Each row of the kymograph is obtained by a 2.6-μm-wide line scan through the middle of the cell along the migration direction. Cell is migrating toward the right. The green line corresponds to the green leading edge in (E) and the red line corresponds to the red retracting edge in (E). (E) Maximal intensity projection of actin-YFP (top) and MRLC-mApple (bottom) in the cell frame of reference, showing the direction of actin (top) and MRLC (bottom) retrograde flow. The image integrated the fluorescent signals over a 96-s period. Green color marks the leading edge and red color marks the retracting edge. Image contrast in (A), (B), and (E) was adjusted to emphasize the actin and myosin puncta. (F) The trajectories of three individual myosin puncta (blue). (G) The rate of increase in fluorescence intensity from 67 MRLC puncta in a single cell was measured to estimate the binding rate of myosin to F-actin (see STAR Methods). The average apparent doubling time for myosin accumulation was 40 ± 20 s. (H) A partial differential equation model in one dimension with only two variables: Mb is the bound myosin and Mf is the cytoplasmic (free) myosin. The four parameters are V (velocity of the retrograde flow), D (diffusion coefficient of the cytoplasmic myosin), kon (attachment rate of myosin to F-actin), and koff (detachment rate of bound myosin from F-actin). (I) The response of the myosin localization score to a simulated oscillatory speed with a period of 1.25 min. (J) The cross-correlation analysis between the cell speed and the myosin localization score generated a temporal offset of 15 s. (K) A sensitivity analysis of the response time of myosin when each of the four parameters are tuned up or down 9-fold.
Reprinted from Developmental Cell, 49, Tsai, T.Y., Collins, S.R., Chan, C.K., Hadjitheodorou, A., Lam, P.Y., Lou, S.S., Yang, H.W., Jorgensen, J., Ellett, F., Irimia, D., Davidson, M.W., Fischer, R.S., Huttenlocher, A., Meyer, T., Ferrell, J.E., Theriot, J.A., Efficient Front-Rear Coupling in Neutrophil Chemotaxis by Dynamic Myosin II Localization, 189-205.e6, Copyright (2019) with permission from Elsevier. Full text @ Dev. Cell