
|
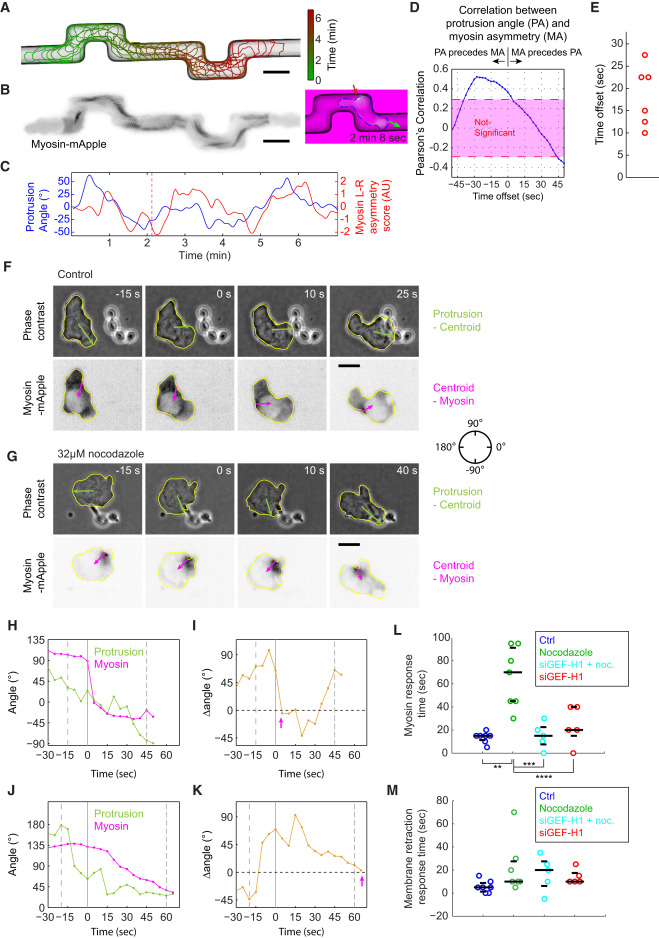
Fig. 6 Rapid Myosin Dynamics Is Preserved in HL60 Cells Forced to Turn Mechanically and Facilitates Quick Re-orientation of the Rear during Chemotaxis (A) A 6.7-min trajectory of an HL60 cell migrating within a microfluidic channel, with 12.5-s intervals. Scale bars in (A), (B), (F), and (G) represent 10 μm. (B) A maximal intensity projection of the MRLC-mApple fluorescent images. The colored image at the right of the maximal intensity projection is a snapshot of the the cell when it is turning within the channel. Green arrow indicates the protrusion direction, while the red arrow highlights the myosin flash. (C) The dynamics of protrusion angle (blue) versus myosin left-right asymmetry score (red) reveal the correlation between the two parameters with some temporal offset. (D) Cross-correlation analysis between the protrusion angle and the myosin left-right asymmetry shown in (C) reveals maximal correlation at an offset of 27.5 s. (E) Summary of the temporal offset between protrusion angle and myosin left-right asymmetry in 6 distinct videos from 3 cells migrating in the microfluidic channel. Each video contains at least 3 90° turns. (F and G) Snapshots of phase contrast images and inverted MRLC-mApple fluorescent images from a control (F) or nocodazole-treated (G) HL60 cell migrating toward a C. albicans cell. The green arrows are the directions from the cell centroid to the point with the fastest protrusion velocity. The magenta arrows are the direction from the point with maximal myosin intensity to the cell centroid. (H and J) The temporal dynamics of protrusion direction and myosin contraction direction as the control (H) and nocodazole-treated (J) cell approaches the C. albicans cell. (I and K) The angular difference between the protrusion and myosin contraction direction as the control (I) and nocodazole-treated (K) cell approaches the fungal cell. The pink arrows represent the recorded myosin response time in (L). (H and K) The first dashed line represents the initiation of the turning event. The second solid line represents the time when the protrusion direction aligns with the C. albicans cell. The last dashed line represents the completion of phagocytosis. (L) The response time of myosin localization after the protrusion aligns with the Candida cell under different conditions. Response time of nocodazole-treated cells is significantly different from all other samples with p < 0.05 (∗) or p < 0.005 (∗∗) by Student’s t test. (M) The response time of membrane retraction after the protrusion aligns with the Candida cell under different conditions. (L and M) The three black lines are the 25th, 50th, and 75th percentile of the data. Sample sizes in the format of (number of cells, number of experiments) are control (7, 2), nocodazole (7, 4), siGEF-H1 + nocodazole (5, 2), and siGEF-H1 (5, 2).
Reprinted from Developmental Cell, 49, Tsai, T.Y., Collins, S.R., Chan, C.K., Hadjitheodorou, A., Lam, P.Y., Lou, S.S., Yang, H.W., Jorgensen, J., Ellett, F., Irimia, D., Davidson, M.W., Fischer, R.S., Huttenlocher, A., Meyer, T., Ferrell, J.E., Theriot, J.A., Efficient Front-Rear Coupling in Neutrophil Chemotaxis by Dynamic Myosin II Localization, 189-205.e6, Copyright (2019) with permission from Elsevier. Full text @ Dev. Cell