
|
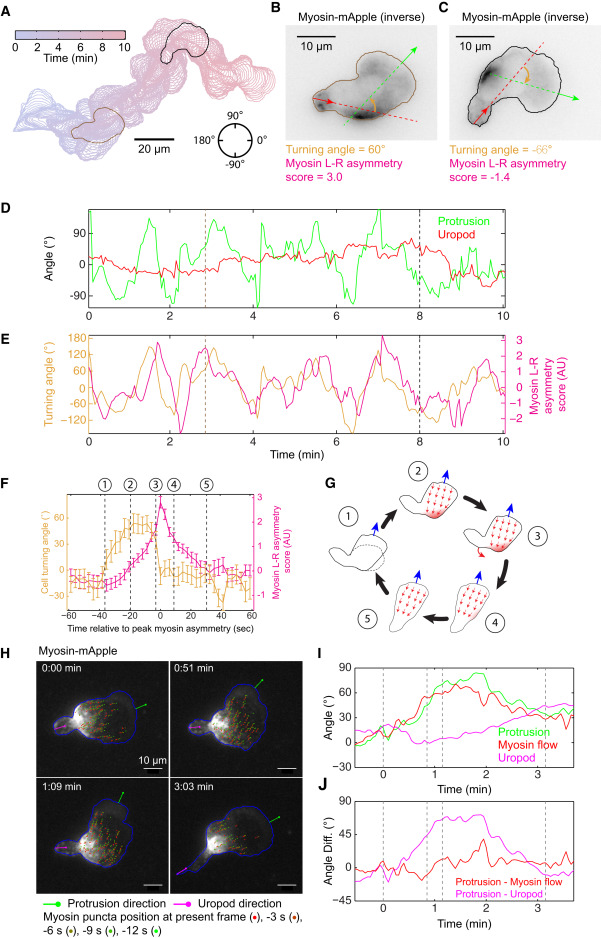
Fig. 5 Asymmetric Myosin Localization Follows Directional Change of the Protrusion to Facilitate Efficient Turning (A) A 10-min trajectory of a frequently turning HL60 cell, with 3-s intervals. (B and C) Snapshots of inverse fluorescent images of MRLC-mApple at 2 min 51 s (B) and 8 min (C) as examples for cells turning left (B) or right (C). Green arrows represent the direction of protrusion, defined as the normal vector from the point at the leading edge with maximal protrusion speed. Red arrows represent the normal direction from the tip of the uropod. The turning angle of the cell is defined as the difference of the green and red arrows, shown in orange. In both cases, myosin localizes to the outside of the turn. (D) The direction of protrusion (green) and uropod (red) throughout the 10-min trajectory. The direction is defined in the circle in (A), with 0° pointing to the right and the angle increases counter-clockwise to 180°, and decreases clockwise to −180°. (E) Turning angle (orange) and myosin left-right asymmetry score (red) throughout the 10-min trajectory. The myosin asymmetry appears to lag behind the turning of the protrusion. (D and E) The brown and black dashed lines correspond to the image shown in (B) and (C), respectively. (F) Summary of the average turning dynamics and the corresponding myosin left-right asymmetry score from 46 turning events in 6 different cells. The signs of myosin asymmetry score and turning angle from a right turn are inversed to allow averaging with left turns. At each turn, the peak of myosin asymmetry is defined as time 0. The turning dynamics and myosin asymmetry score from −60 s to 60 s in all 46 turns are averaged. Error bars represent SEM. (G) Cartoon illustration of the temporal sequence during a turn. The numbers 1 to 5 correspond to the numbers 1 to 5 along the temporal axis in (F). (H) TIRF images of myosin flow in a turning HL60 cell. Green lines are the directions of protrusion. Magenta lines are the directions of the uropod. Blue lines outline the cell contours. Movement of individual myosin puncta in the cell frame of reference were shown for 5 consecutive frames and marked with different colors as described in the figure. (I and J) Myosin flow direction closely follows the protrusion direction, while the uropod lags behind during cell turning. The direction of protrusion (green), myosin flow (red) and uropod (magenta) in the lab frame of reference are shown in (I). The differences between protrusion direction and myosin flow (red) and between protrusion and uropod direction (magenta) are shown in (J).
Reprinted from Developmental Cell, 49, Tsai, T.Y., Collins, S.R., Chan, C.K., Hadjitheodorou, A., Lam, P.Y., Lou, S.S., Yang, H.W., Jorgensen, J., Ellett, F., Irimia, D., Davidson, M.W., Fischer, R.S., Huttenlocher, A., Meyer, T., Ferrell, J.E., Theriot, J.A., Efficient Front-Rear Coupling in Neutrophil Chemotaxis by Dynamic Myosin II Localization, 189-205.e6, Copyright (2019) with permission from Elsevier. Full text @ Dev. Cell