
|
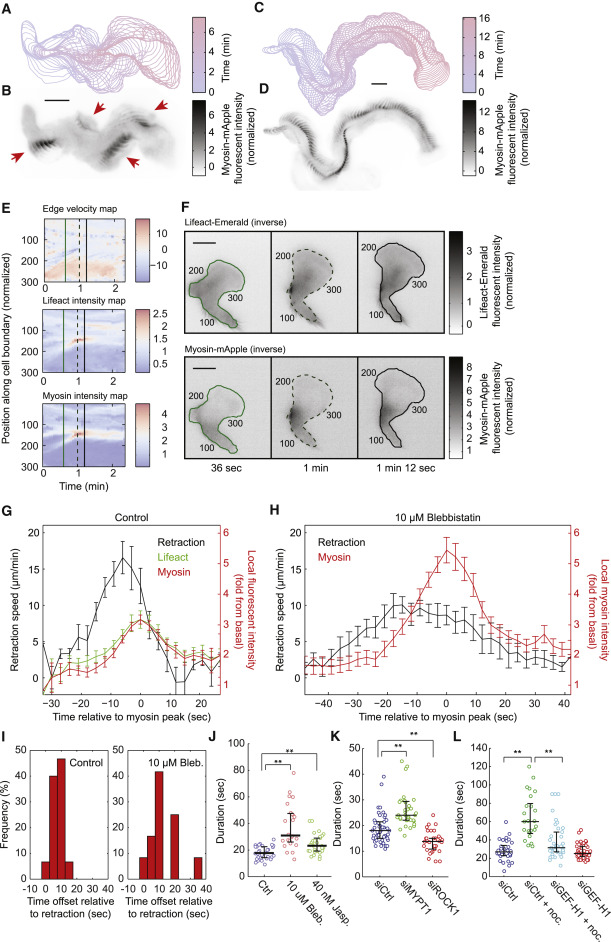
Fig. 4 Myosin Contraction Mediates Rapid Flashes at the Cell Rear (A and C) Contours of a migrating HL60 cell over 400 s (A) and 970 s (C), with 10-s intervals. (B and D) Maximal intensity projection of inverse fluorescent images of MRLC-mApple from migrating cells in (A) and (C). The fluorescence intensity was normalized to the average intensity of the whole cell. (B) The red arrows highlight the spatial discontinuity of each myosin flash. The flashes are typically located at the outside of the turning trajectory. Scale bars in (A–D) and (F) are 10 μm. (E) Local edge velocity, local Lifeact-mEmerald intensity, and local MRLC-mApple intensity along the boundary of the cell over 138 s. In the edge velocity map, a positive velocity represents local protrusion and a negative velocity represents local retraction, with the unit of μm/min. In the local F-actin intensity map and the local myosin intensity map, the fluorescence intensity is normalized to the average of the cell. (F) Snapshots of inverse fluorescent images of Lifeact-mEmerald and MRLC-mApple during a flash. All the fluorescent images are inverted. The three time points correspond to the three vertical lines in (E). The number index along the cell contour corresponds to the number along the vertical axis in the three heatmaps in (E). (G and H) Average dynamics of the myosin flashes from control cells (G) (16 flashes from 3 cells) and blebbistatin-treated cells (H) (14 flashes from 4 cells). Error bars represent SEM. (I) Distribution of temporal offset between local myosin concentration and local retraction velocity in non-treated (15 flashes from 3 cells) and blebbistatin-treated (12 flashes from 4 cells) cells. A positive value means myosin dynamics lags behind retraction velocity. (J–L) Statistics of the duration of the myosin flashes under different conditions. Each open circle represents the average duration of a single cell observed for more than 10 min. Cell numbers: Control (30), blebbistatin (24), jasplakinolide (30) (J). siCtrl (46), siMYPT1 (36), siROCK1 (34) (K). siCtrl (33), siCtrl + nocodazole (25), siGEF-H1 + nocodazole (42), siGEF-H1 (42) (L). ∗∗ p < 0.005 (Student’s t test).
Reprinted from Developmental Cell, 49, Tsai, T.Y., Collins, S.R., Chan, C.K., Hadjitheodorou, A., Lam, P.Y., Lou, S.S., Yang, H.W., Jorgensen, J., Ellett, F., Irimia, D., Davidson, M.W., Fischer, R.S., Huttenlocher, A., Meyer, T., Ferrell, J.E., Theriot, J.A., Efficient Front-Rear Coupling in Neutrophil Chemotaxis by Dynamic Myosin II Localization, 189-205.e6, Copyright (2019) with permission from Elsevier. Full text @ Dev. Cell