
|
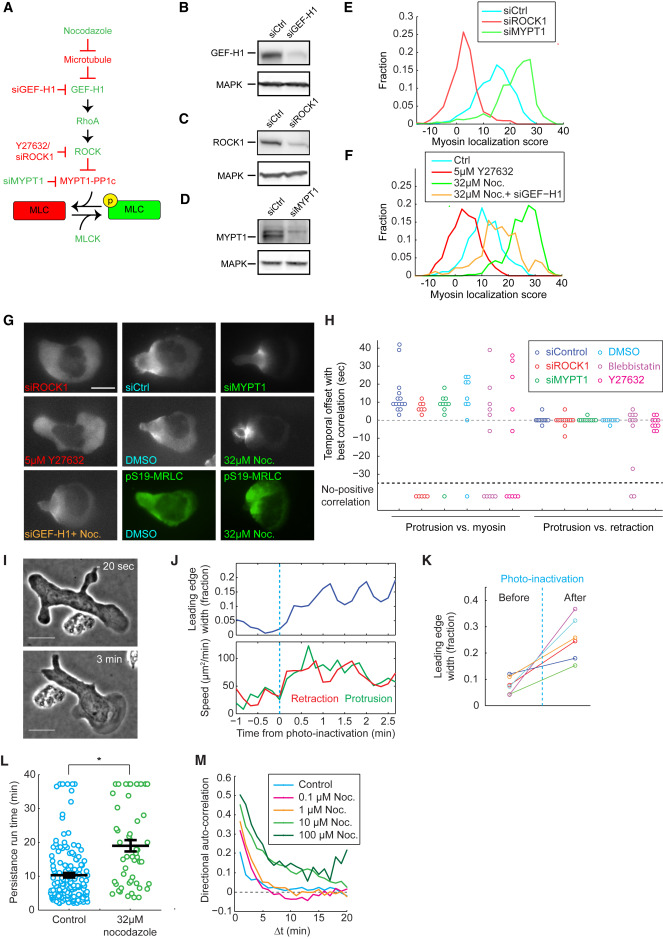
Fig. 3 Intracellular Myosin Distribution Depends on Phosphorylation of Myosin Regulatory Light Chain Myosin contractility is dispensable for front-rear coupling, but affects leading edge dynamics. (A) A signaling cascade regulating MRLC phosphorylation. A protein or perturbation that increases or decreases MRLC phosphorylation are colored green or red, respectively. (B–D) Western blots of HL60 cell lysates on GEF-H1 (B), ROCK1 (C), MYPT1 (D), and MAPK (B–D), showing the effective knockdown of GEF-H1 (B), ROCK1 (C), and MYPT1 (D) by siRNA. Each blot has been repeated 2 or 3 times. (E and F) Histogram of myosin rearward localization score under different conditions. Sample sizes in the format of (number of images, number of cells): siCtrl (726, 66), siROCK1 (649, 59), siMYPT1 (737, 67) (E), and control (275, 55), Y27632 (220, 44), nocodazole (285, 57), and nocodazole + siGEF-H1(506, 46) (F). (G) Representative snapshots of MRLC-mApple fluorescent images of HL60 cells under different treatments. The two images in green are HL60 cells immunostained with antibody targeting pS19-MRLC. Scale bar represents 10 μm. (H) Summary of the temporal offset between protrusion and retraction (right), and between protrusion and myosin rearward localization score (left). Sample sizes in the format of (number of videos, number of cells): siControl (14, 10), siROCK1 (12, 12), siMYPT1 (10, 7), DMSO control (9, 6), 10μM blebbistatin (11, 11), 10uM Y27632 (10, 10). (I) Snapshots of a blebbistatin-treated cell 20 s before and 3 min after photo-inactivation. Scale bar represents 10 μm. (J) Leading edge, protrusion, and retraction speed before and after blebbistatin photo-inactivation for the cell shown in (I). In (J–K), leading edge width is calculated as the fraction of cell circumference that is actively protruding. Protrusion and retraction speed are defined as in Figure 1B. (K) Change of leading edge width from 6 cells in 3 experiments before and after blebbistatin photo-inactivation. The representative cell shown in (I) and (J) corresponds to the data points in green. (L) Persistence run time for control and nocodazole-treated cells. Each circle represents the average persistence run time for one single cell over an observation time of 40 min. The black lines represent the average, and the average ± standard error of the mean. Control (152 cells from 2 experiments) and nocodazole-treated (52 cells from 2 experiments) values are significantly different at p < 0.005 by Student’s t test (∗∗). (M) The directional auto-correlation (see STAR Methods) of nocodazole-treated cells.
Reprinted from Developmental Cell, 49, Tsai, T.Y., Collins, S.R., Chan, C.K., Hadjitheodorou, A., Lam, P.Y., Lou, S.S., Yang, H.W., Jorgensen, J., Ellett, F., Irimia, D., Davidson, M.W., Fischer, R.S., Huttenlocher, A., Meyer, T., Ferrell, J.E., Theriot, J.A., Efficient Front-Rear Coupling in Neutrophil Chemotaxis by Dynamic Myosin II Localization, 189-205.e6, Copyright (2019) with permission from Elsevier. Full text @ Dev. Cell