
Image
|
Figure Caption
Fig. 3-S1
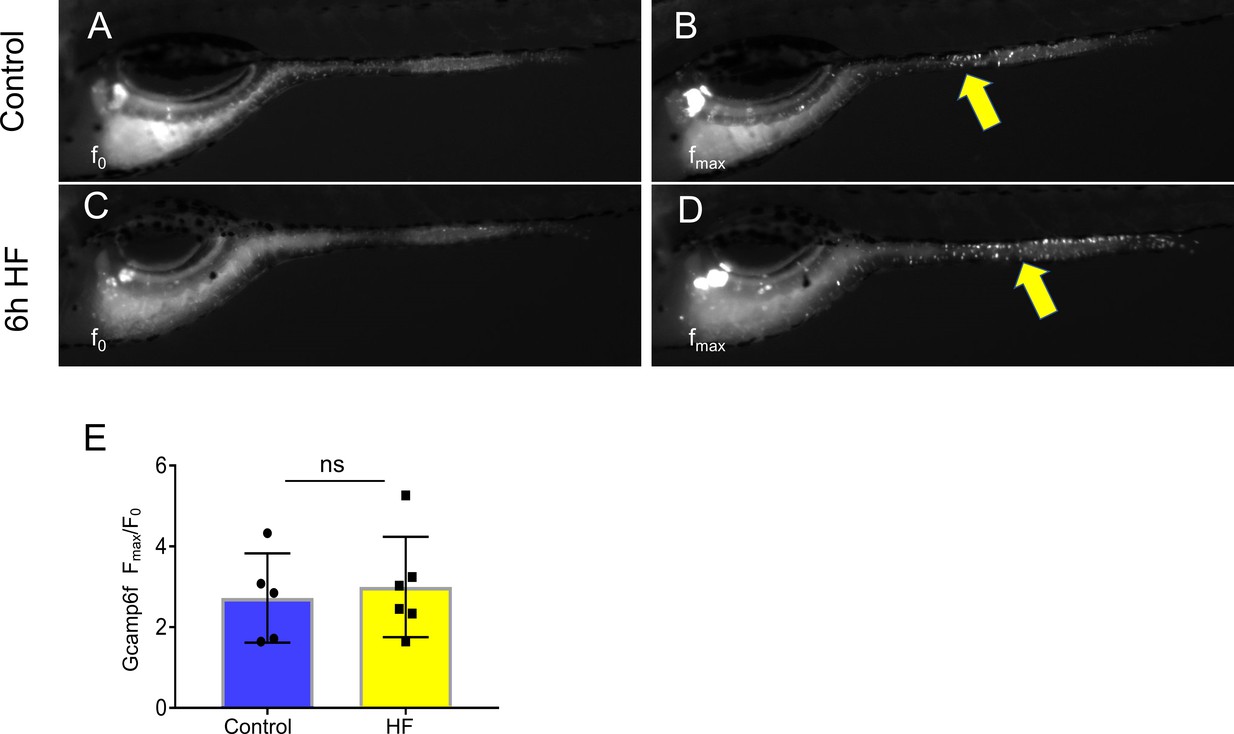
EECs remain responsive to cysteine following high fat feeding.
( A–B) Representative images of the EEC response to cysteine in control Tg(neurod1:Gcamp6f) zebrafish larvae. Note the location of responsive EECs in the mid-intestinal region (segment 2; yellow arrows) ( C–D) Representative images of the EEC response to cysteine in 6 hr high fat (HF) meal fed Tg(neurod1:Gcamp6f) zebrafish larvae. ( E) Quantification of the EEC response to cysteine in control and HF fed zebrafish. Student t-test was used in E for statistical analysis.
Acknowledgments
This image is the copyrighted work of the attributed author or publisher, and
ZFIN has permission only to display this image to its users.
Additional permissions should be obtained from the applicable author or publisher of the image.
Full text @ Elife