
|
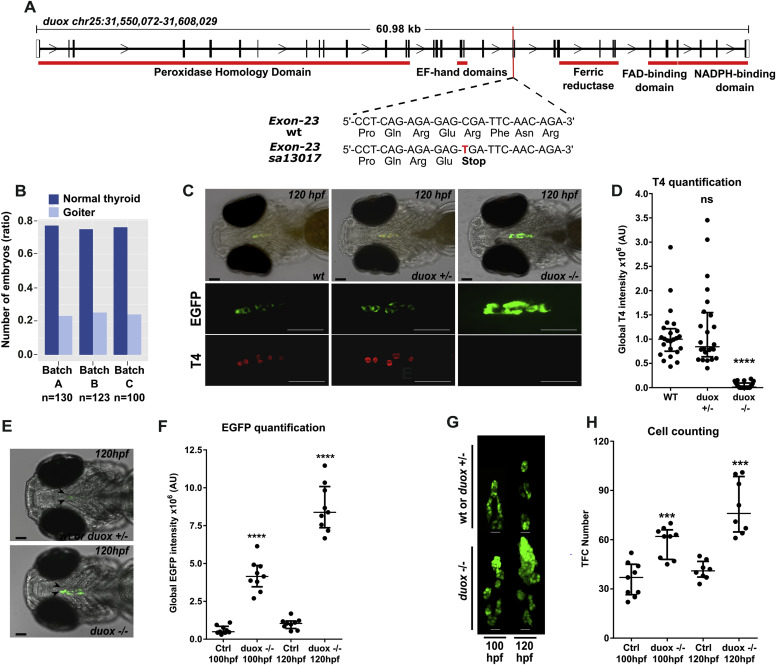
Fig. 1 The duox sa13017 mutant larvae develop dyshormonogenic goiter phenotype (A) Chromosome 25 genomic locus with duox sequences for wild-type (WT) and mutant (duox sa13017) alleles. A single nucleotide exchange (C–T) in duox gene generates a stop codon in the exon 23 after the glutamate 997 and upstream of the regions encoding the functional domains of the protein. (B) Proportion of larvae (120 hpf) presenting a goitrous thyroid phenotype as detected in the progeny from three independent mating experiments of heterozygous duox sa13017 fish. (C) Whole-mount immunofluorescence (WIF) staining for EGFP and T4 of 120 hpf duox sa13017 mutants showed strong reduction of detectable T4 signal and thyroid enlargement in all homozygous (−/−) mutant larvae compared to WT and heterozygous (+/-) larvae. Epifluorescence images are shown (ventral views, anterior to the left, scale bars: 75 μm). (D) Quantification of colloidal T4 immunofluorescence signals. Data are presented in a scatter plot with the median and the interquartile ranges, dots representing the total follicular T4 intensity of individual fish. Eight specimens per genotype were analyzed from three independent experiments. No statistical difference (ns) was observed between WT and heterozygous (+/-) duox sa13017 mutants. (E–F) Epifluorescence live imaging analysis of 100 and 120 hpf duox sa13017 larvae. Panel E shows representative images of the thyroid region in heterozygous and homozygous mutant duox sa13017 fish at 120 hpf (ventral view of the head, anterior to the left, scale bars: 75 μm). Arrow heads point to the thyroidal EGFP reporter signal. Panel F shows the quantification of EGFP signals in 100 and 120 hpf larvae. Scatter plots show the median with the interquartile ranges. Dots represent the global EGFP intensity of individual fish (n = 9). Ctrl: WT or heterozygous duox sa13017 mutant larvae. (G) Confocal live imaging of duox sa13017 larvae (100 and 120 hpf). 3D reconstruction of thyroid tissue shows a clear thyroid enlargement associated with the homozygous duox sa13017 mutation at 120 hpf (ventral view, anterior to the top). Scale bars: 20 μm. (H) Quantification of thyroid follicular cell (TFC) number in WT or heterozygous duox mutants (Ctrl) and homozygous duox sa13017 (−/−) mutants. Scatter plots show the median with the interquartile ranges. Each dot represents the total cell number of individual fish (n = 7–9). Mann-Whitney tests were performed to compare duox (−/−) mutants with their respective 100 or 120 hpf control specimens.
Reprinted from Molecular and Cellular Endocrinology, 500, Giusti, N., Gillotay, P., Trubiroha, A., Opitz, R., Dumont, J.E., Costagliola, S., De Deken, X., Inhibition of the thyroid hormonogenic H2O2 production by Duox/DuoxA in zebrafish reveals VAS2870 as a new goitrogenic compound, 110635, Copyright (2019) with permission from Elsevier. Full text @ Mol. Cell. Endocrinol.