
|
Fig. 1
Whole brain activity mapping reveals anti-correlated hypothalamic regions.
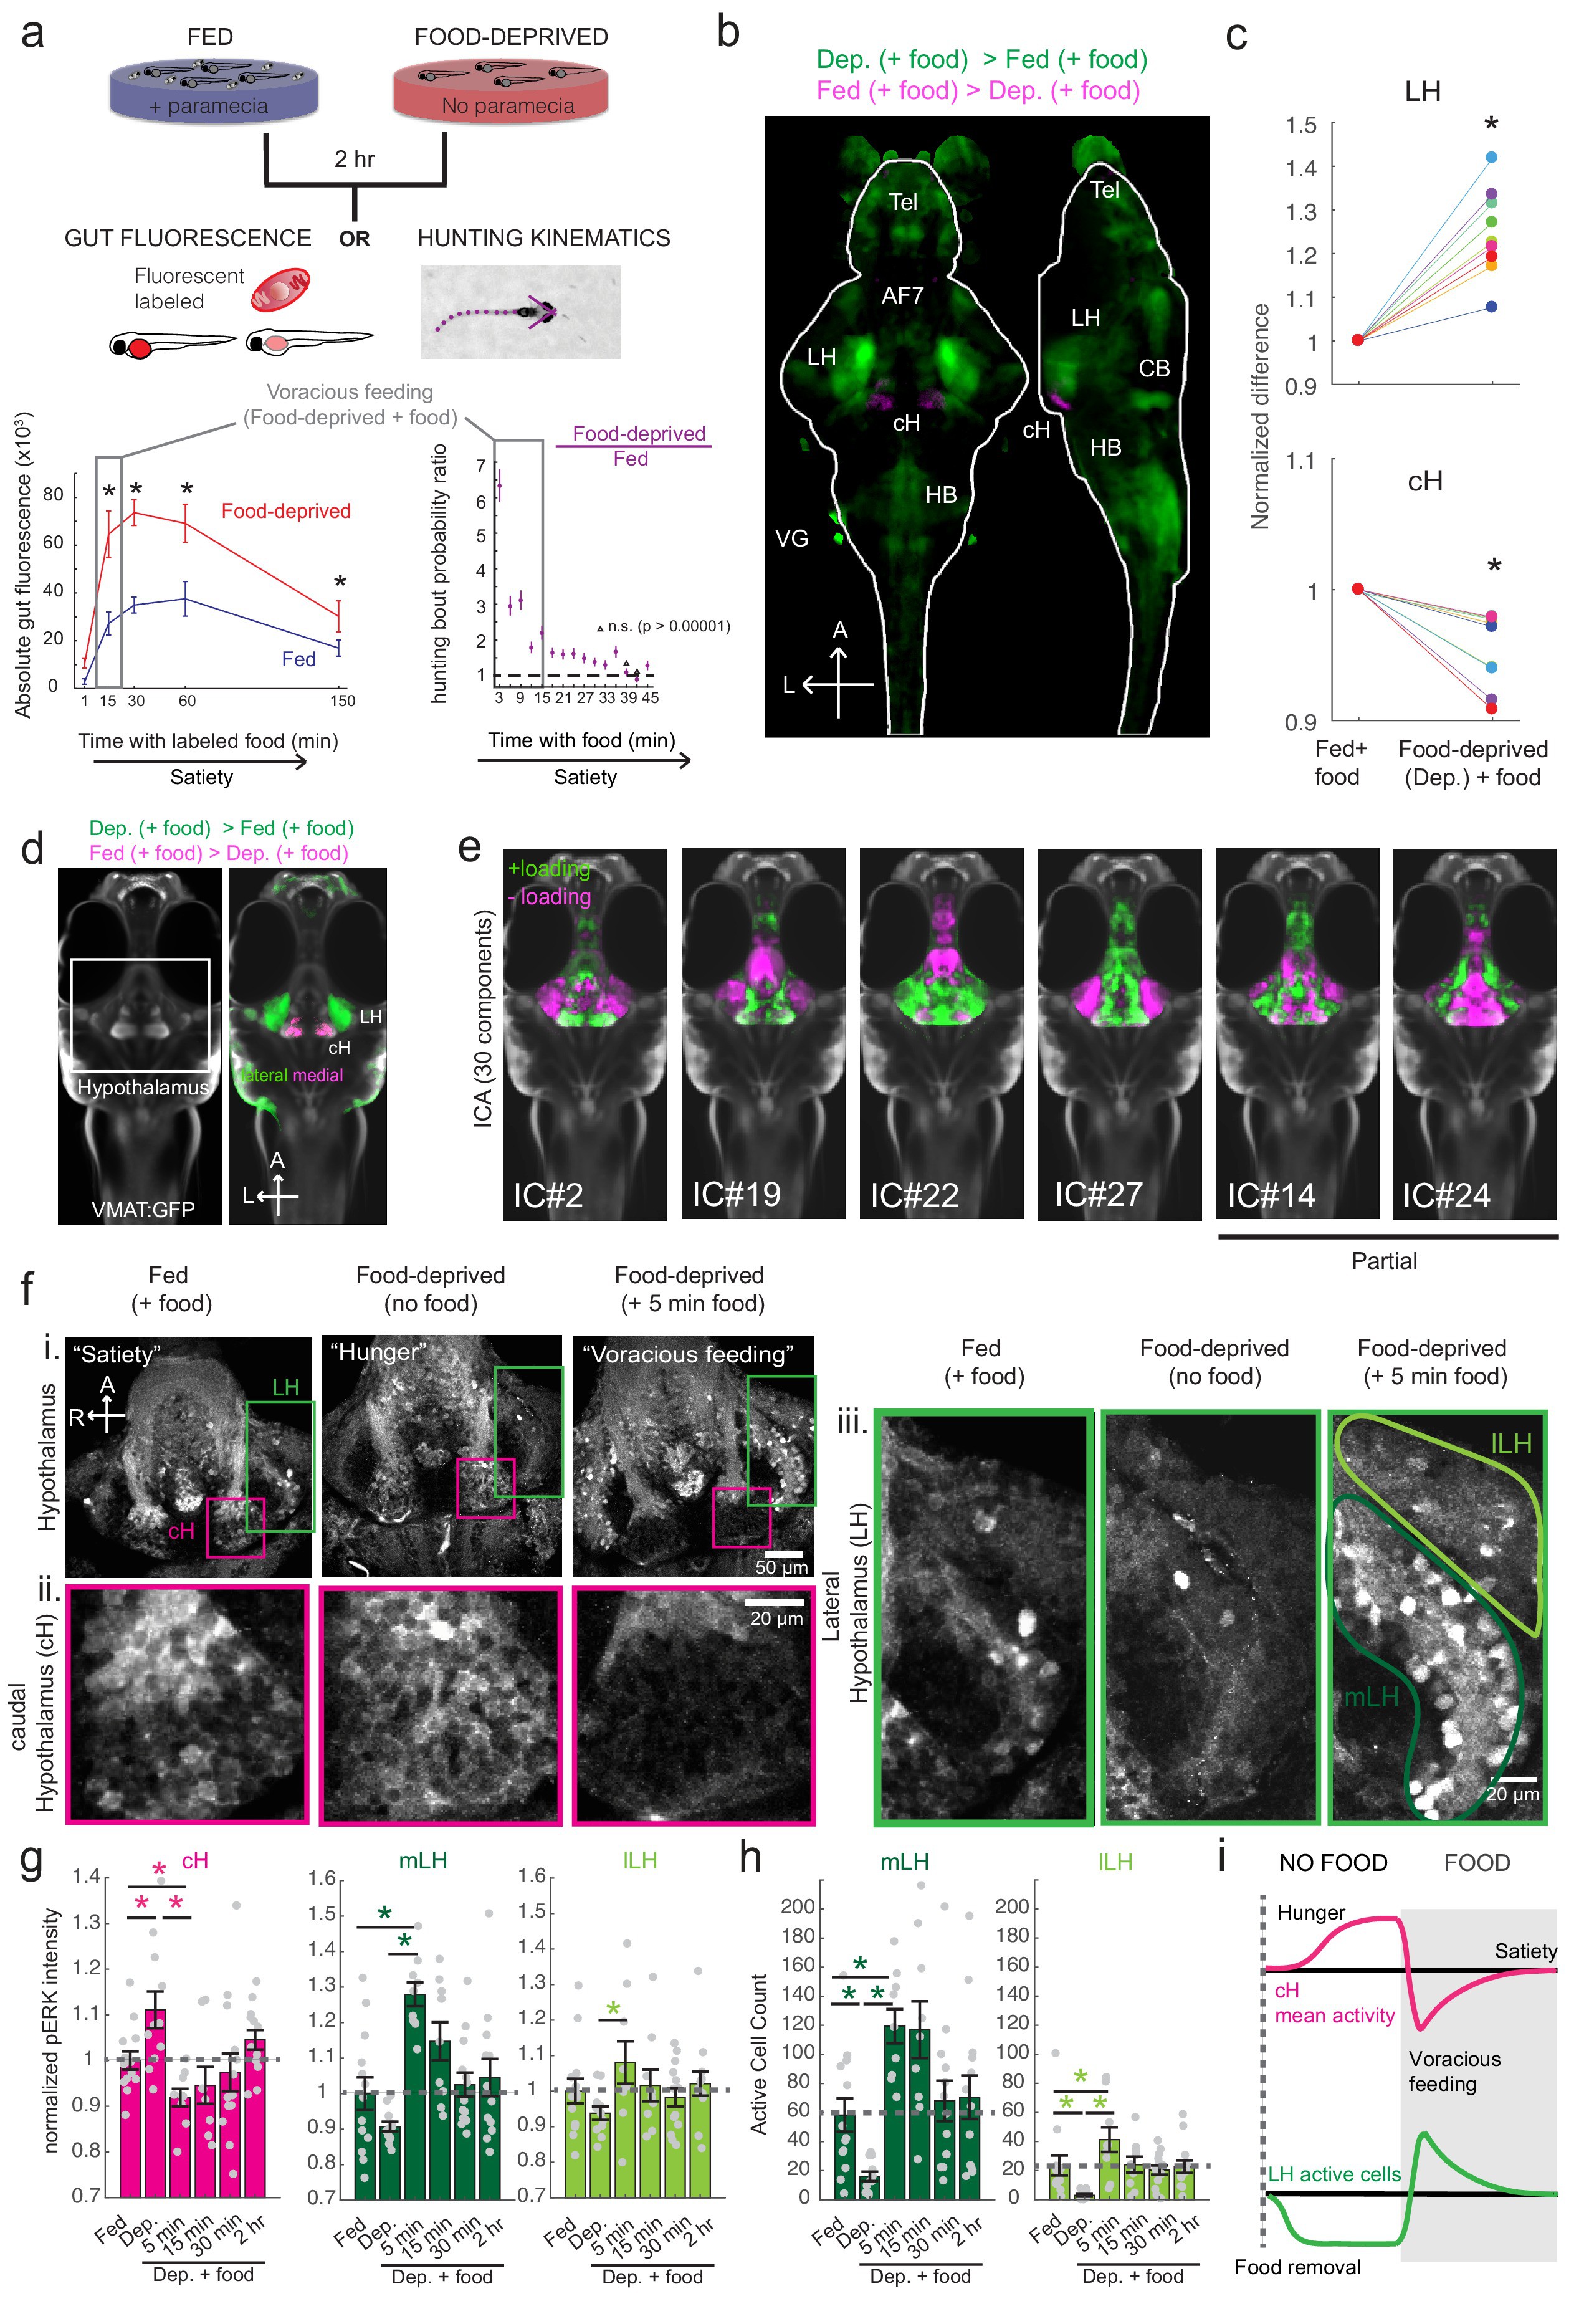
( a) Top: The protocols used to quantify feeding behavior in larval zebrafish. At 7 or 8 dpf, larvae were either food-deprived for 2 hr, or fed with excess paramecia for this duration. After 2 hr (2–4 hr in the case of behavioral imaging), they were subject to a quick wash, followed either by: 1) addition of excess fluorescently-labeled paramecia (left), 2) high-resolution behavioral imaging (right; see Johnson et al., 2019, and Materials and methods). Gut fluorescence is both cumulative and diminished by digestion ( Jordi et al., 2015) and so lags the dynamics of hunting behavior. Bottom left: Gut fluorescence measurements of food-deprived (red) or fed (blue) fish as a function of duration of feeding labeled paramecia. Groups of fed or food-deprived larvae were fixed at the indicated time points (fed: n = 7/18/19/17/17 fish, food-deprived: n = 8/23/20/14/15 fish). Food-deprived fish had significantly higher gut fluorescence than fed fish overall (p = 7.5859×10⁻¹⁰, Two-way ANOVA, asterisk indicates corrected p-values<0.05. Bottom right: The probability of performing a hunting-related swim bout across fed and food-deprived fish groups in 3 min time bins over 45 min. Error bars represent 90% confidence intervals. For all bins except those indicated with triangles, the null hypothesis that initial feeding condition has no effect on hunting-bout probability is rejected (p<0.00001, Fisher’s Exact Test comparing binomial probability distributions per bin). Fed: n = 85655 bouts from 73 fish; Food-deprived: n = 75357 bouts from 57 fish. Since the rate of food intake and hunting behavior was highest in the first 15 min (voracious feeding phase, gray boxes), we chose this time point for subsequent MAP-mapping experiments. ( b) Brain-wide activity mapping of food-deprived (Dep.) fish exposed to food for 15 min, with subtraction of activity in continuously fed (Fed) fish. Data from nine experiments were combined to generate this difference map based on anti-pERK staining fluorescence. Relative activation from feeding after food deprivation yields activated regions including the telencephalon (Tel), Arborization field 7 (AF7), cerebellum (CB), hindbrain (HB), Vagal ganglion (VG) and lateral lobe of the intermediate hypothalamus (LH). Reduced activity was observed in the caudal hypothalamus (cH) and some areas of the telencephalon. Scale bar = 100 μm. Also see Video 1. ( c) ROI-specific pixel intensity analysis of LH and cH regions in nine independent MAP-mapping experiments (20–30 fish per treatment per experiment). The cH or LH ROI intensities of each individual fish was normalized to the mean cH or LH ROI intensity of all fed fish. Food-deprived fish consistently displayed higher LH and lower cH pERK fluorescence after the onset of feeding (p = 0.0019 for both cH and LH, one-tailed Wilcoxon signed-rank test). ( d) Z-projection of same MAP-map as described in ( b) in planes revealing the hypothalamus (right panel), where lateral regions (e.g. lateral hypothalamus, LH) display strong relative activation and medial regions (e.g. caudal hypothalamus, cH) display reduced activity in when food-deprived animals were fed for 15 min. The map is overlaid onto a stack for the transgenic line Tg(VMAT:GFP) (left panel) to localize the cH region. ( e) Six examples of independent component analysis (ICA) maps. Voxels for each recovered independent component (IC) are shown as maximum projections, with intensity proportional to the z-score of the loadings of the ICA signal. These ICs, along with others (22/30) highlight LH and cH regions of opposite loadings, suggesting they may be included in a network that displays anti-correlated activity patterns between the cH and LH. A subset of these ICs (e.g. #14 and #24) only showed partial anti-correlation between the cH and the LH. All ICs are shown in Figure 1—figure supplement 3. Positive (+) loading and Negative (-) loadings (z-score values of IC signals) are reflected in green and magenta, respectively. ( f) Confocal micrographs of anti-pERK antibody stained brains from animals that were continuously fed (panel (i), left), food-deprived for 2 hr (panel (i), center) and fed for 5 min after food deprivation (panel (i), right). cH (ii) and LH (iii) insets are shown at higher magnification on the bottom and right side respectively. The lateral hypothalamus is shown with subdivisions lateral lateral hypothalamus (lLH) and medial lateral hypothalamus (mLH). (i) scale bar: 50 μm; (ii) and (iii) scale bar: 20 μm. Fish are mounted ventral side up. ( g) Quantification of cH and LH activities by normalized anti-pERK fluorescence intensity averaging. The normalized anti-pERK staining intensity for each region (ROI) was obtained by dividing the anti-pERK fluorescence from each fish (in all experimental groups) by the average anti-pERK fluorescence for the same ROI of continuously fed fish. Quantitative analysis performed on fish in six independent conditions (n = 13/11/9/9/13/12). Normalized anti-pERK fluorescence intensity (cH/mLH/lLH): Fed vs Dep. (p = 0.016/0.12/0.11), Dep. vs Dep. + 5 min food (p = 3.1×10⁻⁴/9.9 × 10−5/0.020), Fed vs Dep. + 5 min food (p = 0.0097/8.5 × 10−4/0.11). Asterisks denote p<0.05, one-tailed Wilcoxon rank-sum test. ( h) The active cell count metric (bottom panels) was determined as described in Figure 1—figure supplement 4 by a thresholding protocol to isolate and count individual pERK-positive cells within a z-stack. This approach could be reliably performed for areas of sparse active cells (e.g. mLH and lLH) but not where individually labeled pERK-positive neurons are not well separated (such as the cH). Active cell count (mLH/lLH): Fed vs Dep. (p = 0.001/0.0038), Dep. vs Dep. + 5 min food (p = 9.7×10⁻⁵/1.3 × 10−5), Fed vs Dep. + 5 min food (p = 0.0038/0.048). Asterisks denote p<0.05, one-tailed Wilcoxon rank-sum test. ( i) Schematic of inferred cH and LH activity in relation to feeding behavior. Note that, based on data in Figure 2, the LH active cell count appears to decline more rapidly than the rise in cH activity (based on cH average fluorescence intensity). Data plotted in Figure 1are provided in Figure 1—source data 1.