
|
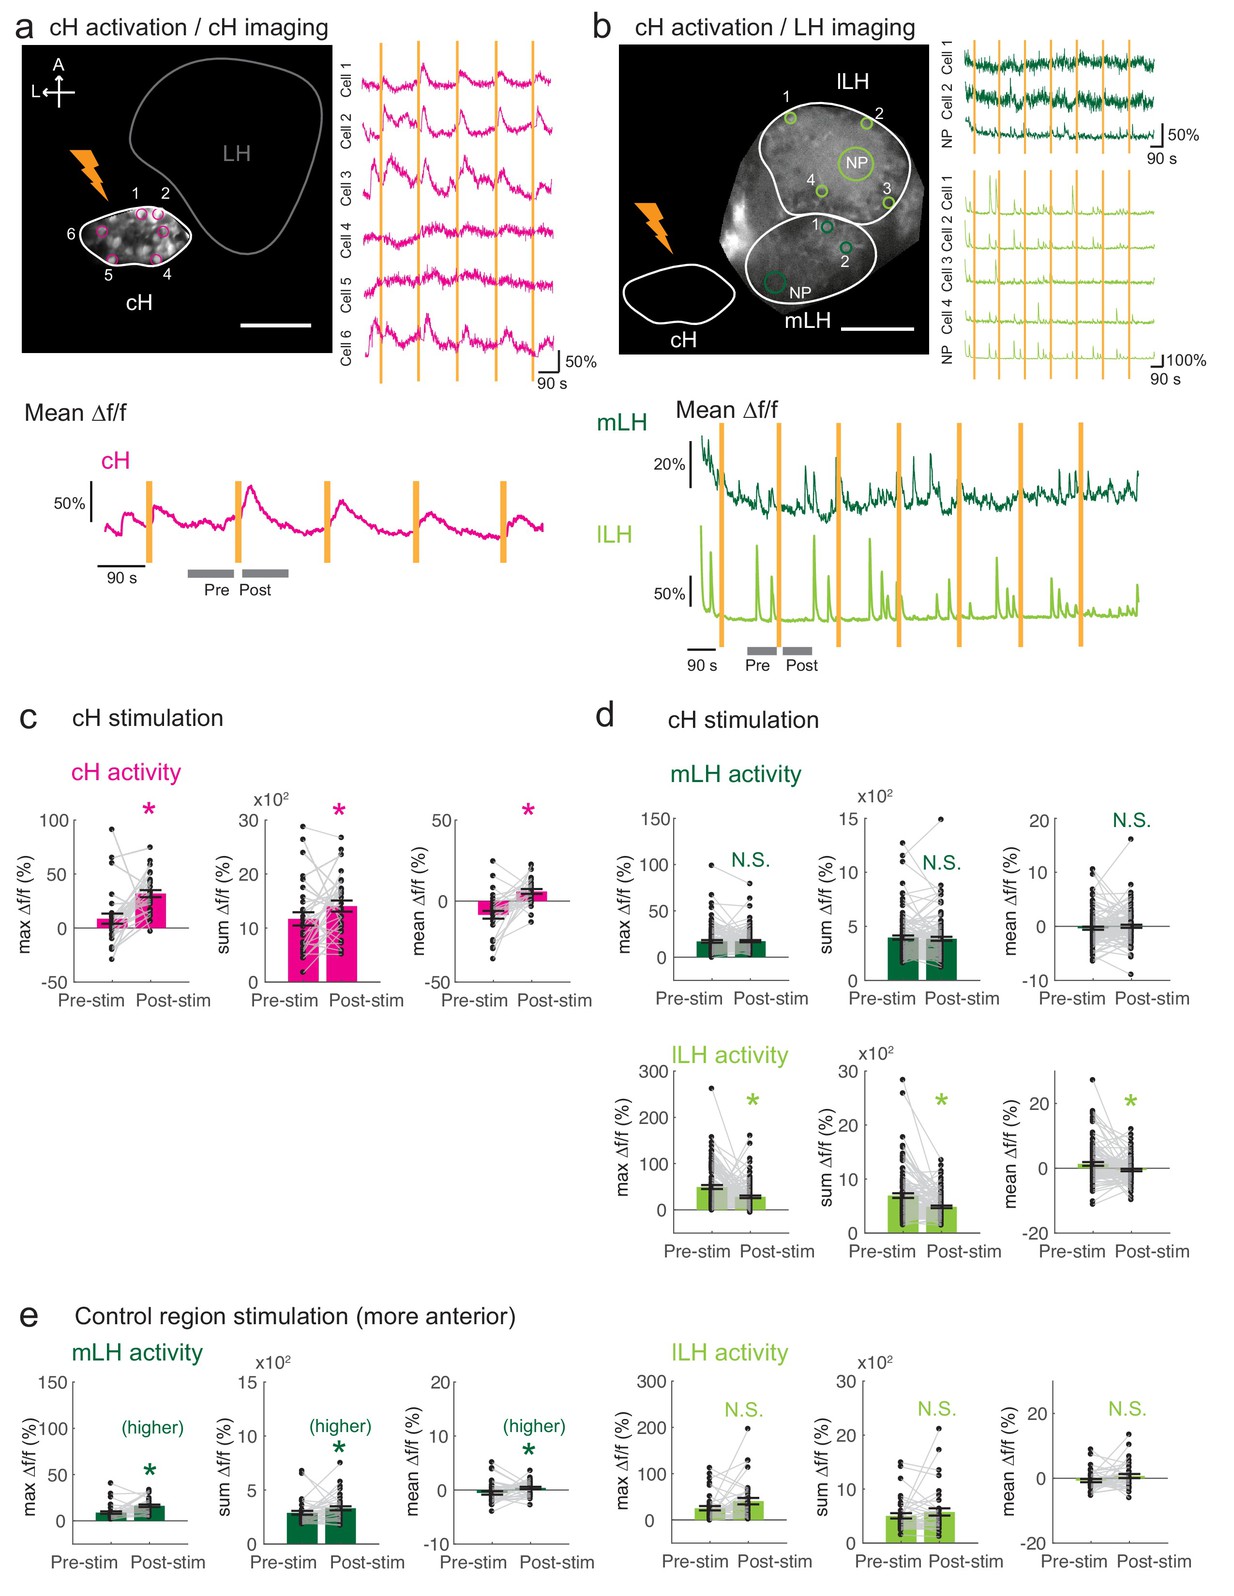
Fig. 5
Optogenetic cH stimulation reduces lLH activity in tethered fish.
( a) ReaChR activation of neurons. Top Panels: Targeted 633 nm laser illumination (see Materials and methods) of a defined cH area (imaged area) in Tg(y333:Gal4;UAS:ReaChR-RFP; UAS:GCaMP6s) fish. These animals express a Tg( UAS:GCaMP6s) reporter in the cH under Tg(y333:Gal4)control. The animals were subjected to repetitive 10 s laser illumination, with a periodicity of 120 s. Following the 633 nm laser pulses, there is widespread induction of cH activity, as indicated by GCaMP fluorescence (Δf/f) in most regions of interest plotted to the right of the image panel. Scale bar = 50 μm. Bottom Panel: Mean Δf/f across the entire outlined cH region versus time. Laser illumination pulses are indicated by orange bars. Gray bars indicate pre- and post-stimulation periods for which metrics shown in ( c–e) were determined. ( b) Inhibition of LH activity by activation of cH neurons in Tg(y333:Gal4;UAS:ReaChR-RFP; HuC:GCaMP6s) fish. The animals were subjected to repetitive 10 s laser illumination, with a periodicity of 180 s. Laser pulses were delivered to the cH (orange lightning symbol) as in a, and calcium imaging was recorded from the indicated LH areas (white outlines). Region of interest traces are shown to the right of the image panel for the indicated areas ( cells and neuropil ( NP)). There is an apparent reduction of spontaneous lLH GCaMP fluorescence spikes in the post-stimulation period. Scale bar = 50 μm. Bottom: Mean Δf/f across mLH and lLH ROIs over time. ( c–e) Comparison of mean, summed and maximum Δf/f metrics for a 90 s window before and after ReaChR stimulation (gray bars in bottom panels in a and b). Each data point represents a single stimulation event, like those shown in a and b. Asterisks denote p<0.05. ( c) cH activity increases after illumination of Tg(y333:Gal4; UAS:ReaChR-RFP)-positive cH neurons, n = 29 stimulations across eight fish, p = 0.0002 (max Δf/f) / 0.036 (sum Δf/f) / 9.2×10⁻⁵ (mean Δf/f), one-tailed Wilcoxon signed-rank test. ( d) lLH activity is inhibited (p = 0.0003 (max Δf/f) / 1.8×10⁻⁶ (sum Δf/f) / 0.049 (mean Δf/f)), whereas mLH activity appears unchanged after after illumination of Tg(y333:Gal4; UAS:ReaChR-RFP)-positive cH neurons (p = 0.74 (max Δf/f) / 0.85 (sum Δf/f) / 0.13 (mean Δf/f)), n = 108 stimulations across nine fish, two-tailed Wilcoxon signed-rank test. ( e) Illumination of a control preoptic region (outside of the area labeled by Tg(y333:Gal4; ReaChR-RFP) expression) resulted in a small increase in mLH activity (p = 0.0003 (max Δf/f) / 0.039 (sum Δf/f) / 0.039 (mean Δf/f)) and no change lLH activity (p = 0.099 (max Δf/f) / 0.65 (sum Δf/f) / 0.096 (mean Δf/f)), n = 37 stimulations across five fish, two-tailed Wilcoxon signed-rank test. Data plotted in Figure 5 are provided in Figure 5—source data 1.