
|
Fig. 4
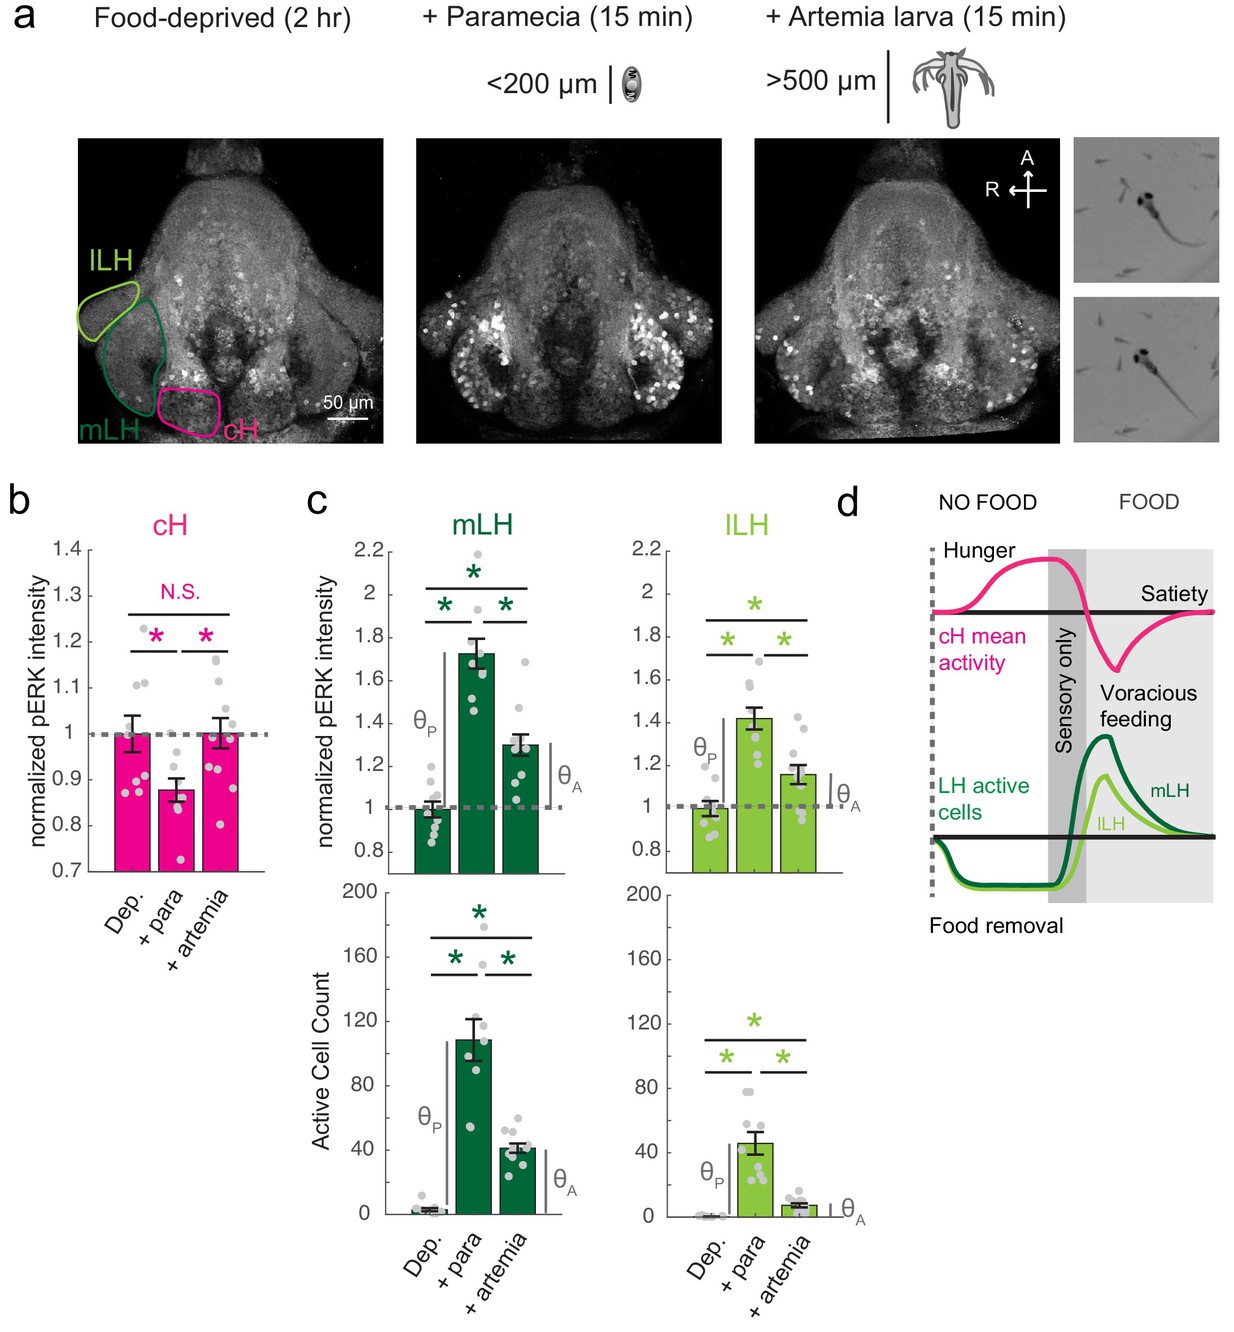
Sensory cues and prey ingestion differentially regulate cH and LH neural activity.
( a) Representative images of activity induced by exposure of 7–8 dpf larval zebrafish to paramecia or artemia larvae, as examined by anti-pERK antibody staining. Hatched artemia are actively hunted but are too large to consume, allowing for the dissociation of sensory cues and hunting behavior from prey consumption. Scale bar = 50 μm. Rightmost two panels (top and bottom): Larval zebrafish hunt live artemia, performing J-turns and pursuits with eyes converged (see Video 4; Bianco et al., 2011). ( b) cH activity (normalized pERK fluorescence intensity) is significantly reduced by exposure to paramecia but not by exposure to artemia (p = 0.016 (paramecia), 0.648 (artemia)). Asterisks denote p<0.05. ( c) LH activity can be induced by artemia, and more strongly by paramecia. Both normalized pERK intensity (mLH: p = 2.06×10⁻⁵ (paramecia vs control), p = 7.09×10⁻⁴ (artemia vs control), p = 5.43×10⁻⁵ (artemia vs paramecia); lLH: p = 2.06×10⁻⁵ (paramecia vs control), p = 0.020 (artemia vs control), p = 0.0019 (artemia vs paramecia)) and active cell count (mLH: p = 2.06×10⁻⁵ (paramecia vs control), p = 9.58×10⁻⁵ (artemia vs control), p = 1.77×10⁻⁴ (artemia vs paramecia); lLH: p = 2.06×10⁻⁵ (paramecia vs control), p = 9.75×10⁻⁵ (artemia vs control), p = 9.86×10⁻⁵ (artemia vs paramecia)) are shown, with n = 9/9/11 fish, one-tailed Wilcoxon rank-sum test. Anti-pERK staining fluorescence was averaged over each entire region of interest (cH, mLH and lLH; see Materials and methods for details). The normalized anti-pERK staining intensity for each region (ROI) was obtained by dividing the anti-pERK fluorescence from each fish (in all experimental groups) by the average anti-pERK fluorescence for the same ROI of food-deprived (i.e. control) fish. We also compared the artemia-induced activity change (θA) to the paramecia-induced activity change (θP) for each lobe (see main text). ( d) Differential neural activation of the cH and LH regions in response to prey sensation and hunting as compared to prey ingestion. Data plotted in Figure 4 are provided in Figure 4—source data 1.