
|
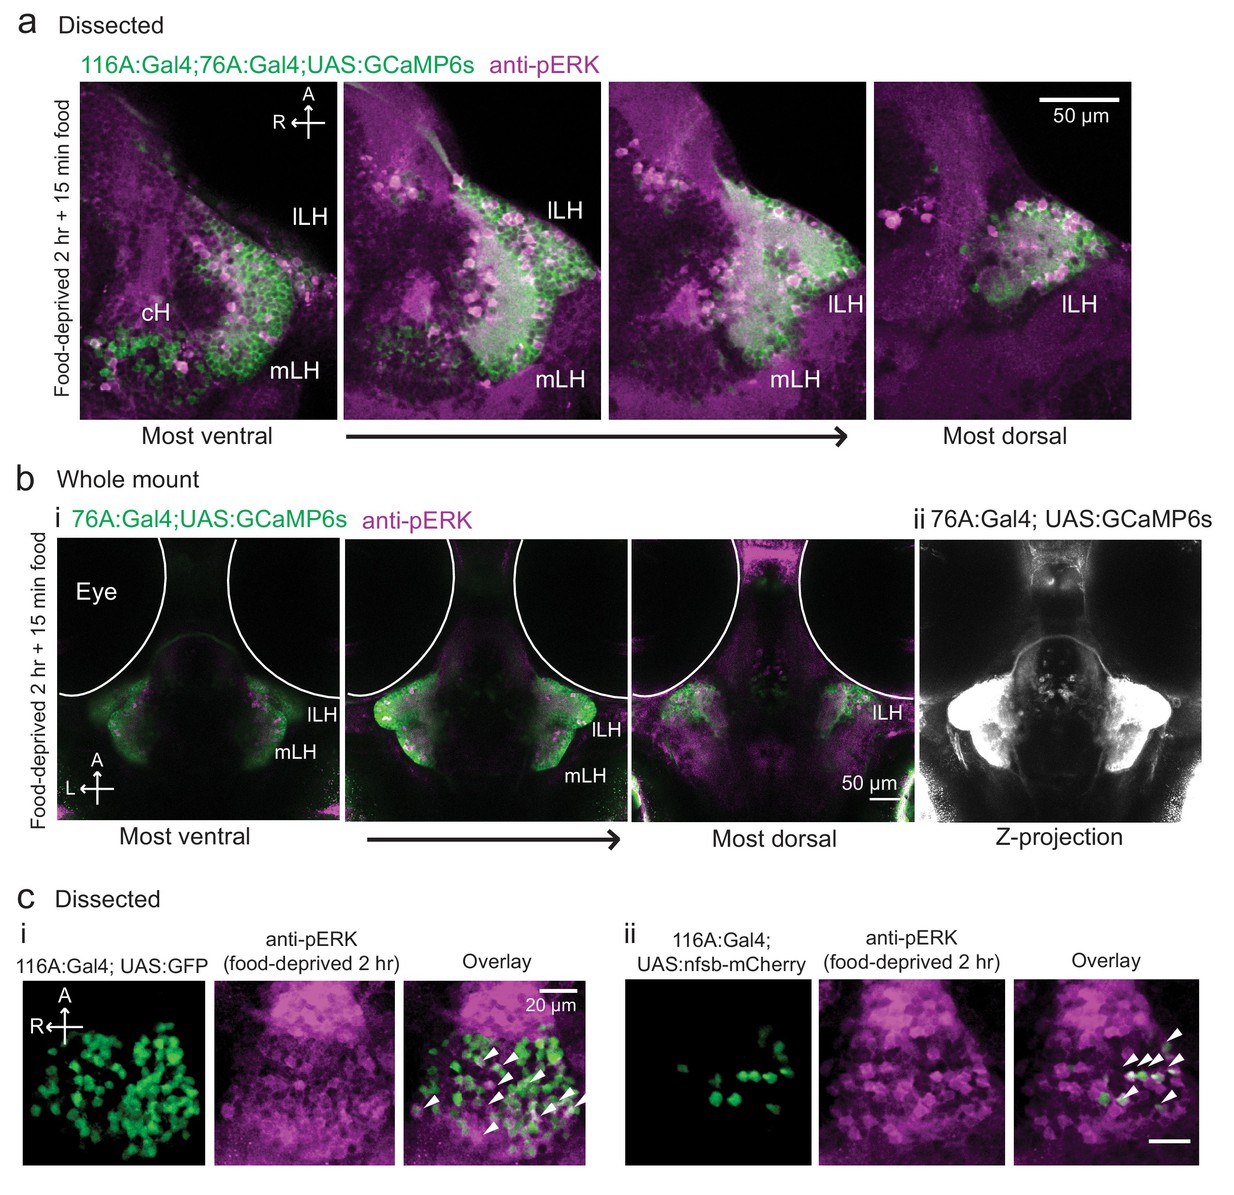
Fig. 3-S2
Overlap of 116A:Gal4 and 76A:Gal4 driven reporter expression with hypothalamic activity under conditions of food deprivation and feeding.
( a) mLH and lLH activity in voraciously-feeding (food-deprived 2 hr + 15 min paramecia) fish overlaps with Tg(76A:Gal4;UAS:GCaMP6s) expression (green, dissected brains). All visible pERK-positive neurons (magenta) were also co-labeled with GCaMP6s. Tg(116A:Gal4) is also expressed (green). Scale bar = 50 μm. ( b) mLH and lLH activity in voraciously-feeding fish overlaps with Tg(76A:Gal4;UAS:GCaMP6s)expression (whole-mount). All visible pERK-positive neurons were also co-labeled with GFP. Note that more dorsally and anteriorly (as visible in the third panel of (i), and the z-projection in (ii)) other neurons beyond the LH are labeled by Tg(76A:Gal4;UAS:GCaMP6s). Scale bar = 50 μm. ( c) pERK-positive cells (magenta) in 2 hr food-deprived fish overlap partially with Tg(116A:Gal4) expression (green, dissected brains). (i) Overlap with Tg(116A:Gal4;UAS:GFP) (ii) Overlap with Tg(116A:Gal4;UAS:nfsb-mCherry). Scale bar = 20 μm.