
|
Fig. 3
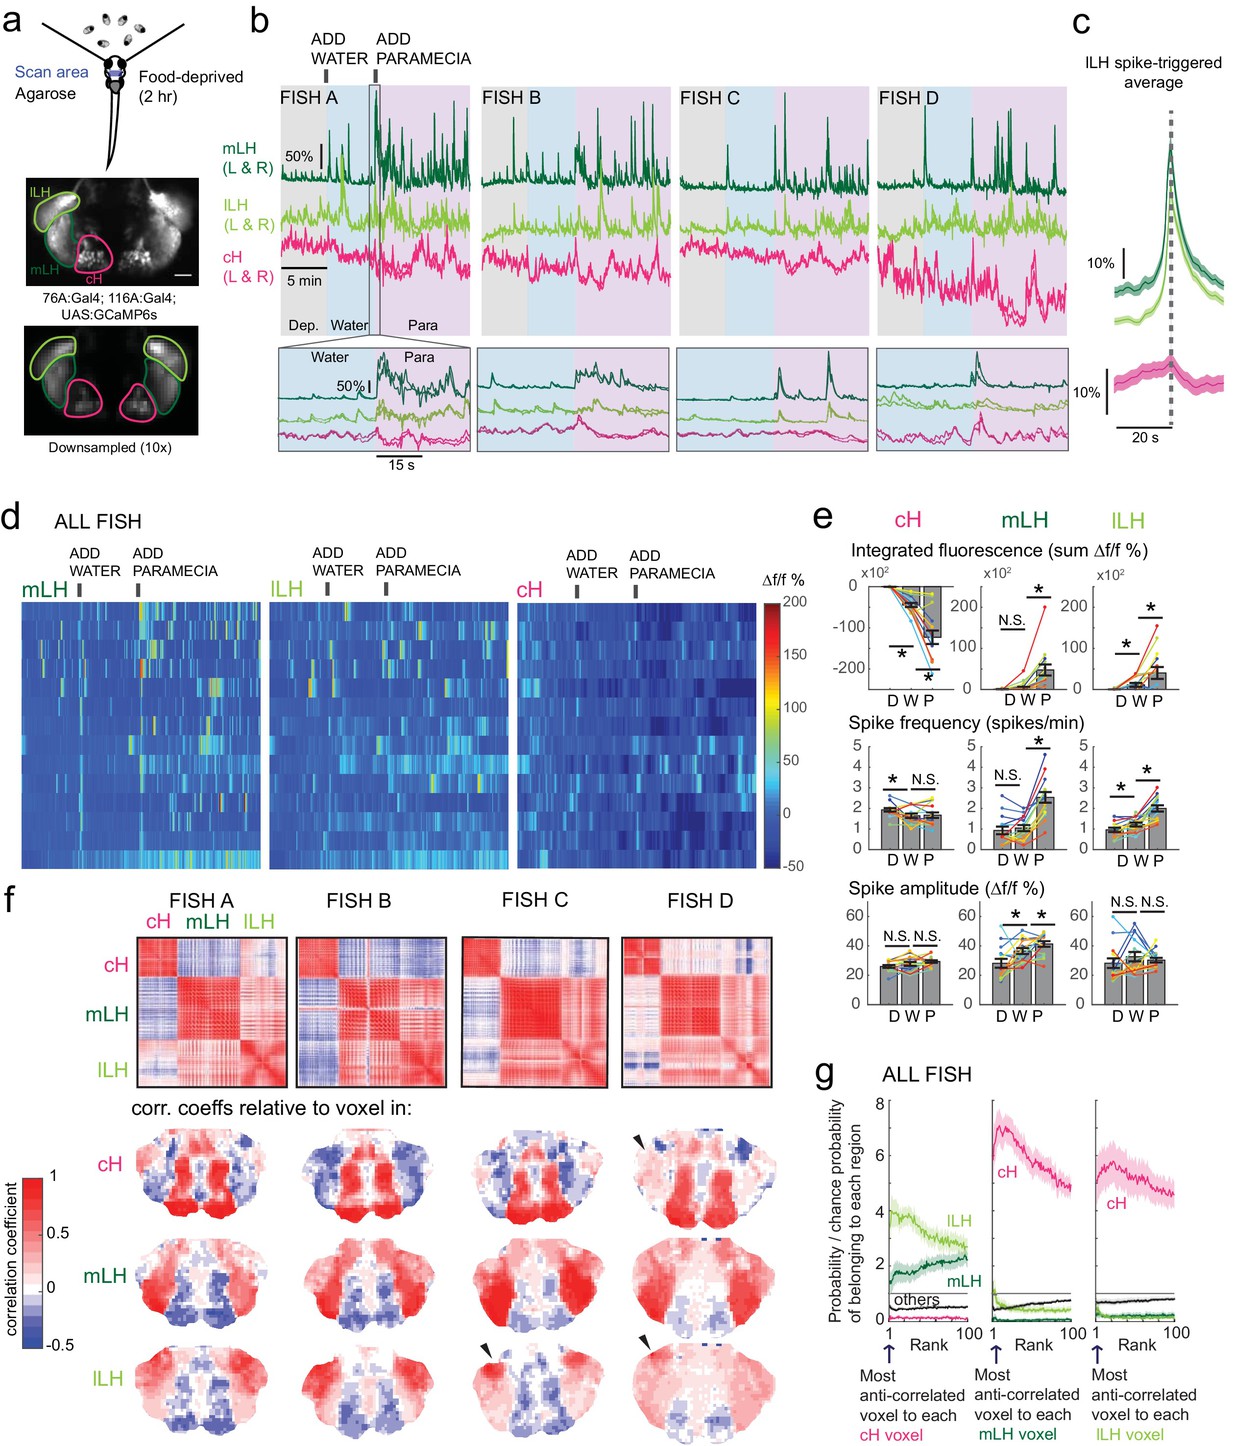
Caudal and lateral hypothalamic responses to prey sensory cues are anti-correlated over short timescales.
( a) Top: Transgenic fish (2 hr food-deprived) with GCaMP6s expressed in cH and LH neurons were paralyzed, tethered in agarose with their eyes and nostrils freed and exposed to live paramecia (prey), as described in Materials and methods. Top image: GCaMP expression in the cH and LH driven by two transgenic lines, Tg(116A:Gal4) and Tg(76A:Gal4) respectively. Bottom image: Downsampled image stack used for analysis in ( f). ( b) Top: Mean calcium activity (Δf/f) from respective hypothalamic ROIs (shown in ( a)) from four individual fish during a baseline food-deprived period (Dep.), exposure to water alone (Water), and a dense water drop of paramecia (Para). Traces from left and right hypothalamic lobes of the same animal are overlain, revealing a high degree of correlated activity on opposite sides of the midline. Paramecia presentation increases activity in the LH and reduces activity in the cH, revealing opposing activity on short timescales. Bottom: Δf/f traces within area marked by gray box (top), displayed at higher magnification. An increase in LH activity and corresponding reduction in cH activity is observable within seconds of paramecia presentation, except for fish D in which maximal responses only occur after a few minutes (beyond the displayed time window). ( c) Average Δf/f triggered on lLH calcium spikes (left and right lobes averaged) shows a mean corresponding reduction in cH activity (n = 159 lLH spikes extracted from mean Δf/f traces from 14 fish across the entire duration of the experiment). ( d) Raster plots showing mean calcium activity from the hypothalamic lobes (left and right lobes averaged) of 14 fish before and after presentation of water alone and water with paramecia. ( e) Quantification of integrated fluorescence (sum Δf/f %), calcium spike frequency (spikes/min) and calcium spike amplitude (Δf/f %) per fish across experimental epochs (300 s food-deprived baseline (D), 300 s after water (W) delivery or 600 s after paramecia delivery (P)). Each colored line represents data from an individual fish (left and right lobes averaged). Water alone was sufficient to significantly reduce cH integrated fluorescence (p = 6.1×10⁻⁵) and spike frequency (p = 0.0127) but not spike amplitude (p = 0.9324). Water alone was similarly sufficient to increase lLH integrated fluorescence (p = 0.029) and spike frequency (p = 0.0098) but not spike amplitude (p = 0.13). Conversely, water alone was not sufficient to significantly modulate mLH integrated fluorescence (p = 0.48) or spike frequency (p = 0.20), but was sufficient to increase spike amplitude (p = 0.039). Paramecia delivery significantly increased mLH and lLH integrated fluorescence (mLH, p = 1.2×10⁻⁴; lLH, p = 0.045) and spike frequency (mLH, p = 6.1×10⁻⁵; lLH, 6.1 × 10⁻⁴), while only significantly increasing mLH spike amplitude (mLH, p = 0.045; lLH, p = 0.43), relative to water delivery. In contrast, paramecia delivery significantly reduced cH integrated fluorescence relative to water delivery alone (p = 3.1×10⁻⁴), but not spike frequency (p = 0.52) nor spike amplitude (p = 0.85). Asterisks denote p<0.05, one-tailed Wilcoxon signed-rank test. ( f) Top: Cross-correlogram of hypothalamic cell-sized voxels (cells and/or neuropil from downsampled image stacks, see ( a)) from four fish. The cH and LH voxels were mostly anti-correlated, whereas voxels within each cluster displayed correlated activity. Black arrowheads indicate region of lLH that appears to be most anti-correlated with the cH. Bottom: Correlation coefficients of other hypothalamic voxels relative to a selected voxel with the cH, mLH or lLH. See color key for numerical translation of color maps. ( g) Summary of data from 14 fish, showing the probability of the nth most anti-correlated voxel belonging to each of the other regions (cH, mLH or lLH), normalized to chance probability (gray line) of belonging to each region (i.e. the fraction of all voxels occupied by each region). For example, if we consider all the voxels within the cH, there is a four-fold probability relative to chance of their most anti-correlated voxels (Rank = 1) being part of the lLH.