
|
Fig. 2
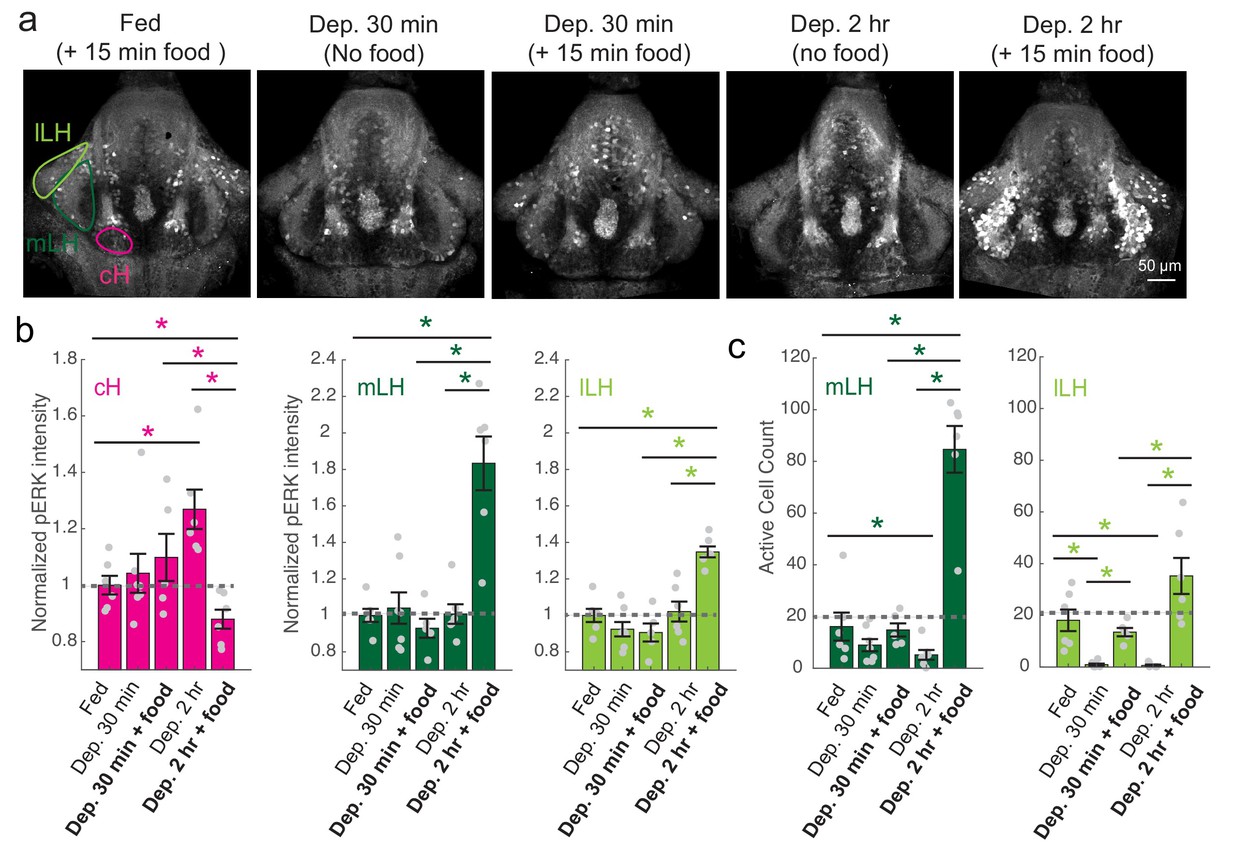
cH and LH activities are modulated by food and satiation state.
( a) Representative images showing that cH, mLH and lLH activities in the presence and absence of food vary with the extent of food deprivation (dataset quantified in b and c). ( b) Normalized pERK average fluorescence intensity in cH significantly increases with food deprivation, and is significantly reduced when food is presented to food-deprived fish. Normalized mLH and lLH pERK average fluorescence intensity does not change significantly during food deprivation and strongly increases during voracious feeding (Dep. 2 hr + 15 min food). Asterisks denote p<0.05. Normalized pERK intensity (cH/mLH/lLH): Fed vs Dep. 30 min (p = 0.53/0.47/0.15), Fed vs Dep. 2 hr (p = 0.0022/0.41/0.59), Dep. 30 min + food vs Dep. 2 hr + food (p = 0.041/0.0022/0.0022), Dep. 30 min vs Dep. 30 min + food (p = 0.62/0.73/0.62), Dep. 2 hr vs Dep. 2 hr + food (p = 0.0022/0.0011/0.0022), Fed vs Dep. 2 hr + food (0.047/0.0011/0.0011). Anti-pERK staining fluorescence was averaged over each entire region of interest (i.e. cH, mLH and lLH; see Materials and methods for details). The normalized anti-pERK staining intensity for each region (ROI) was obtained by dividing the anti-pERK fluorescence from each fish (in all experimental groups) by the average anti-pERK fluorescence for the same ROI of continuously fed fish. ( c) The number of active mLH and lLH cells declines within 30 min of food deprivation, and is significantly enhanced during feeding, particularly after a longer period of food deprivation. Active cell count (mLH/lLH): Fed vs Dep. 30 min (p = 0.155/5.8 × 10−4), Fed vs Dep. 2 hr (p = 0.047/0.011), Dep. 30 min + food vs Dep. 2 hr + food (p = 0.0022/0.0043), Dep. 30 min vs Dep. 30 min + food (p = 0.07/0.013), Dep. 2 hr vs Dep. 2 hr + food (p = 0.0011/0.0011), Fed vs Dep. 2 hr + food (p = 0.0022/0.07), n = 6/7/5/6/6 fish, one-tailed Wilcoxon rank-sum test. Data plotted in Figure 2 are provided in Figure 2—source data 1.