IMAGE

Figure 5

ID
ZDB-IMAGE-200325-132
Source
Figures for Katsouda et al., 2020
Image
Figure Caption

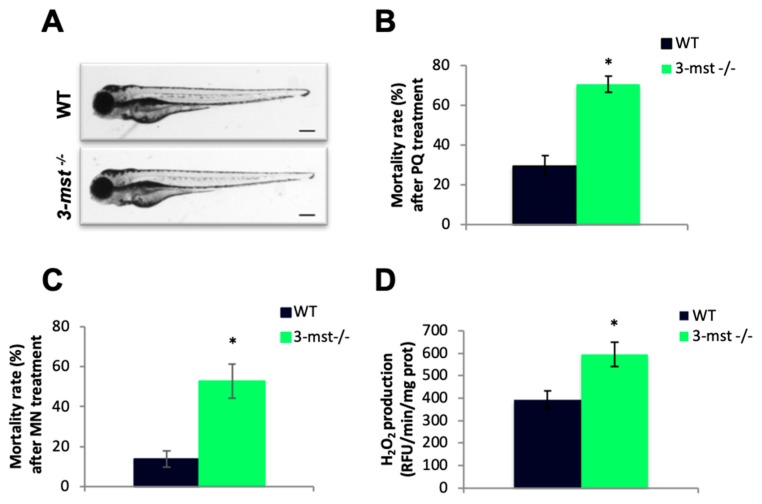
Figure 5

Increased H2O2 production and oxidative stress sensitivity in 3-mst−/− zebrafish. (A) Microscopic images show normal gross morphology of 3-mst−/− larvae at 96 hpf in comparison with WT larvae. Black scale bar: 250 μΜ. (B) Mortality rate of WT and 3-mst−/− larvae after PQ treatment. (C) Mortality rate of WT and 3-mst−/− embryos after menadione (MN) treatment (D) Zebrafish H2O2 levels measured by Amplex Red Fluorescence in homogenates of WT and 3-mst−/− at 96 hpf. Data are presented as mean ± SEM; n = 6–12/genotype; * P < 0.05.

Figure Data
Acknowledgments
This image is the copyrighted work of the attributed author or publisher, and ZFIN has permission only to display this image to its users. Additional permissions should be obtained from the applicable author or publisher of the image. Full text @ Biomolecules