
|
Fig. 3
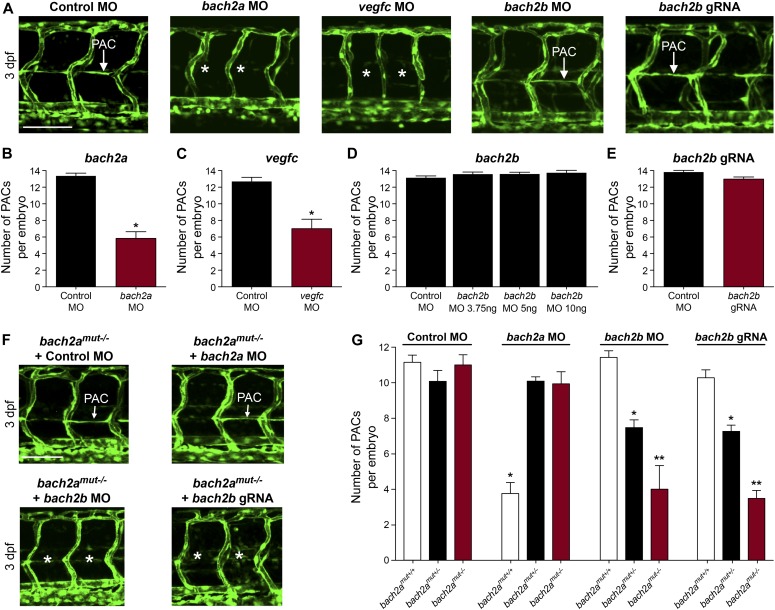
bach2a is essential for parachordal cell (PAC) development in zebrafish embryos.
(A, B) Confocal projection of the trunk of 3-dpf Tg(fli1:EGFP)y1 embryos showing PACs (white arrow) in control MO, bach2b, or bach2b gRNA-injected embryos but not after injection with bach2a or vegfc MO (white asterisk). Scale bar, 100 μm. (B) Number of PAC-containing segments (mean ± SEM) in 3-dpf Tg(fli1:EGFP)y1 zebrafish embryos injected with control MO (10 ng) or bach2a MO (3.75 ng, nControl MO = 46; bach2a MO, nbach2a MO = 53; *P < 0.001). Error bars, mean ± SEM. (C) Number of PAC-containing segments in vegfc MO-injected morphants (10 ng, nControl MO = 53, nvegfc MO= 41; *P < 0.0001). Error bars, mean ± SEM. (D) Number of PAC-containing segments in 3-dpf Tg(fli1:EGFP)y1 zebrafish embryos injected with indicated bach2b MO concentrations (3.75, 5, or 10 ng, nControl MO = 18; nbach2b MO-3.75ng= 30; nbach2b MO-5ng = 30; nbach2b MO-10ng = 10; P ≥ 0.2819). Error bars, mean ± SEM. (E) Quantification of PAC-containing segments in embryos injected with bach2b gRNA (125 ng, nControl MO = 35 nbach2b gRNA = 42; P = 0.0615). Error bars, mean ± SEM. (F) Confocal projection of the trunk region showing PAC-containing segments in Tg(fli1:EGFP)y1-homozygous bach2a mutants (bach2amut−/−) from F2 bach2amut+/− incross. An asterisk indicates the absence of PACs in bach2amut−/− embryos injected with bach2b MO (bach2amut−/− + bach2b MO) or bach2b gRNA (bach2amut−/− + bach2b gRNA) and a white arrow, their presence. Scale bar, 100 μm. (G) Number of PAC-containing segments (mean ± SEM) in 3-dpf embryos randomly selected from bach2a+/− F2 incross progeny injected with control MO (10 ng, nbach2amut + Control MO = 50; P = 0.5514), bach2a MO (3.75 ng, nbach2amut + bach2aMO = 75; *P < 0.0001), bach2b MO (3.75 ng, nbach2amut + bach2b MO = 55; *P and **P < 0.0222), or bach2b gRNA (125 ng, nbach2amut + bach2b gRNA = 137; *P and **P < 0.0001). After genotyping, offspring followed the expected Mendelian ratios of inheritance. (B, C, D, E, G) Wilcoxon rank sum test in panels (B, C, E) and Kruskal–Wallis test in panels (D, G).