
|
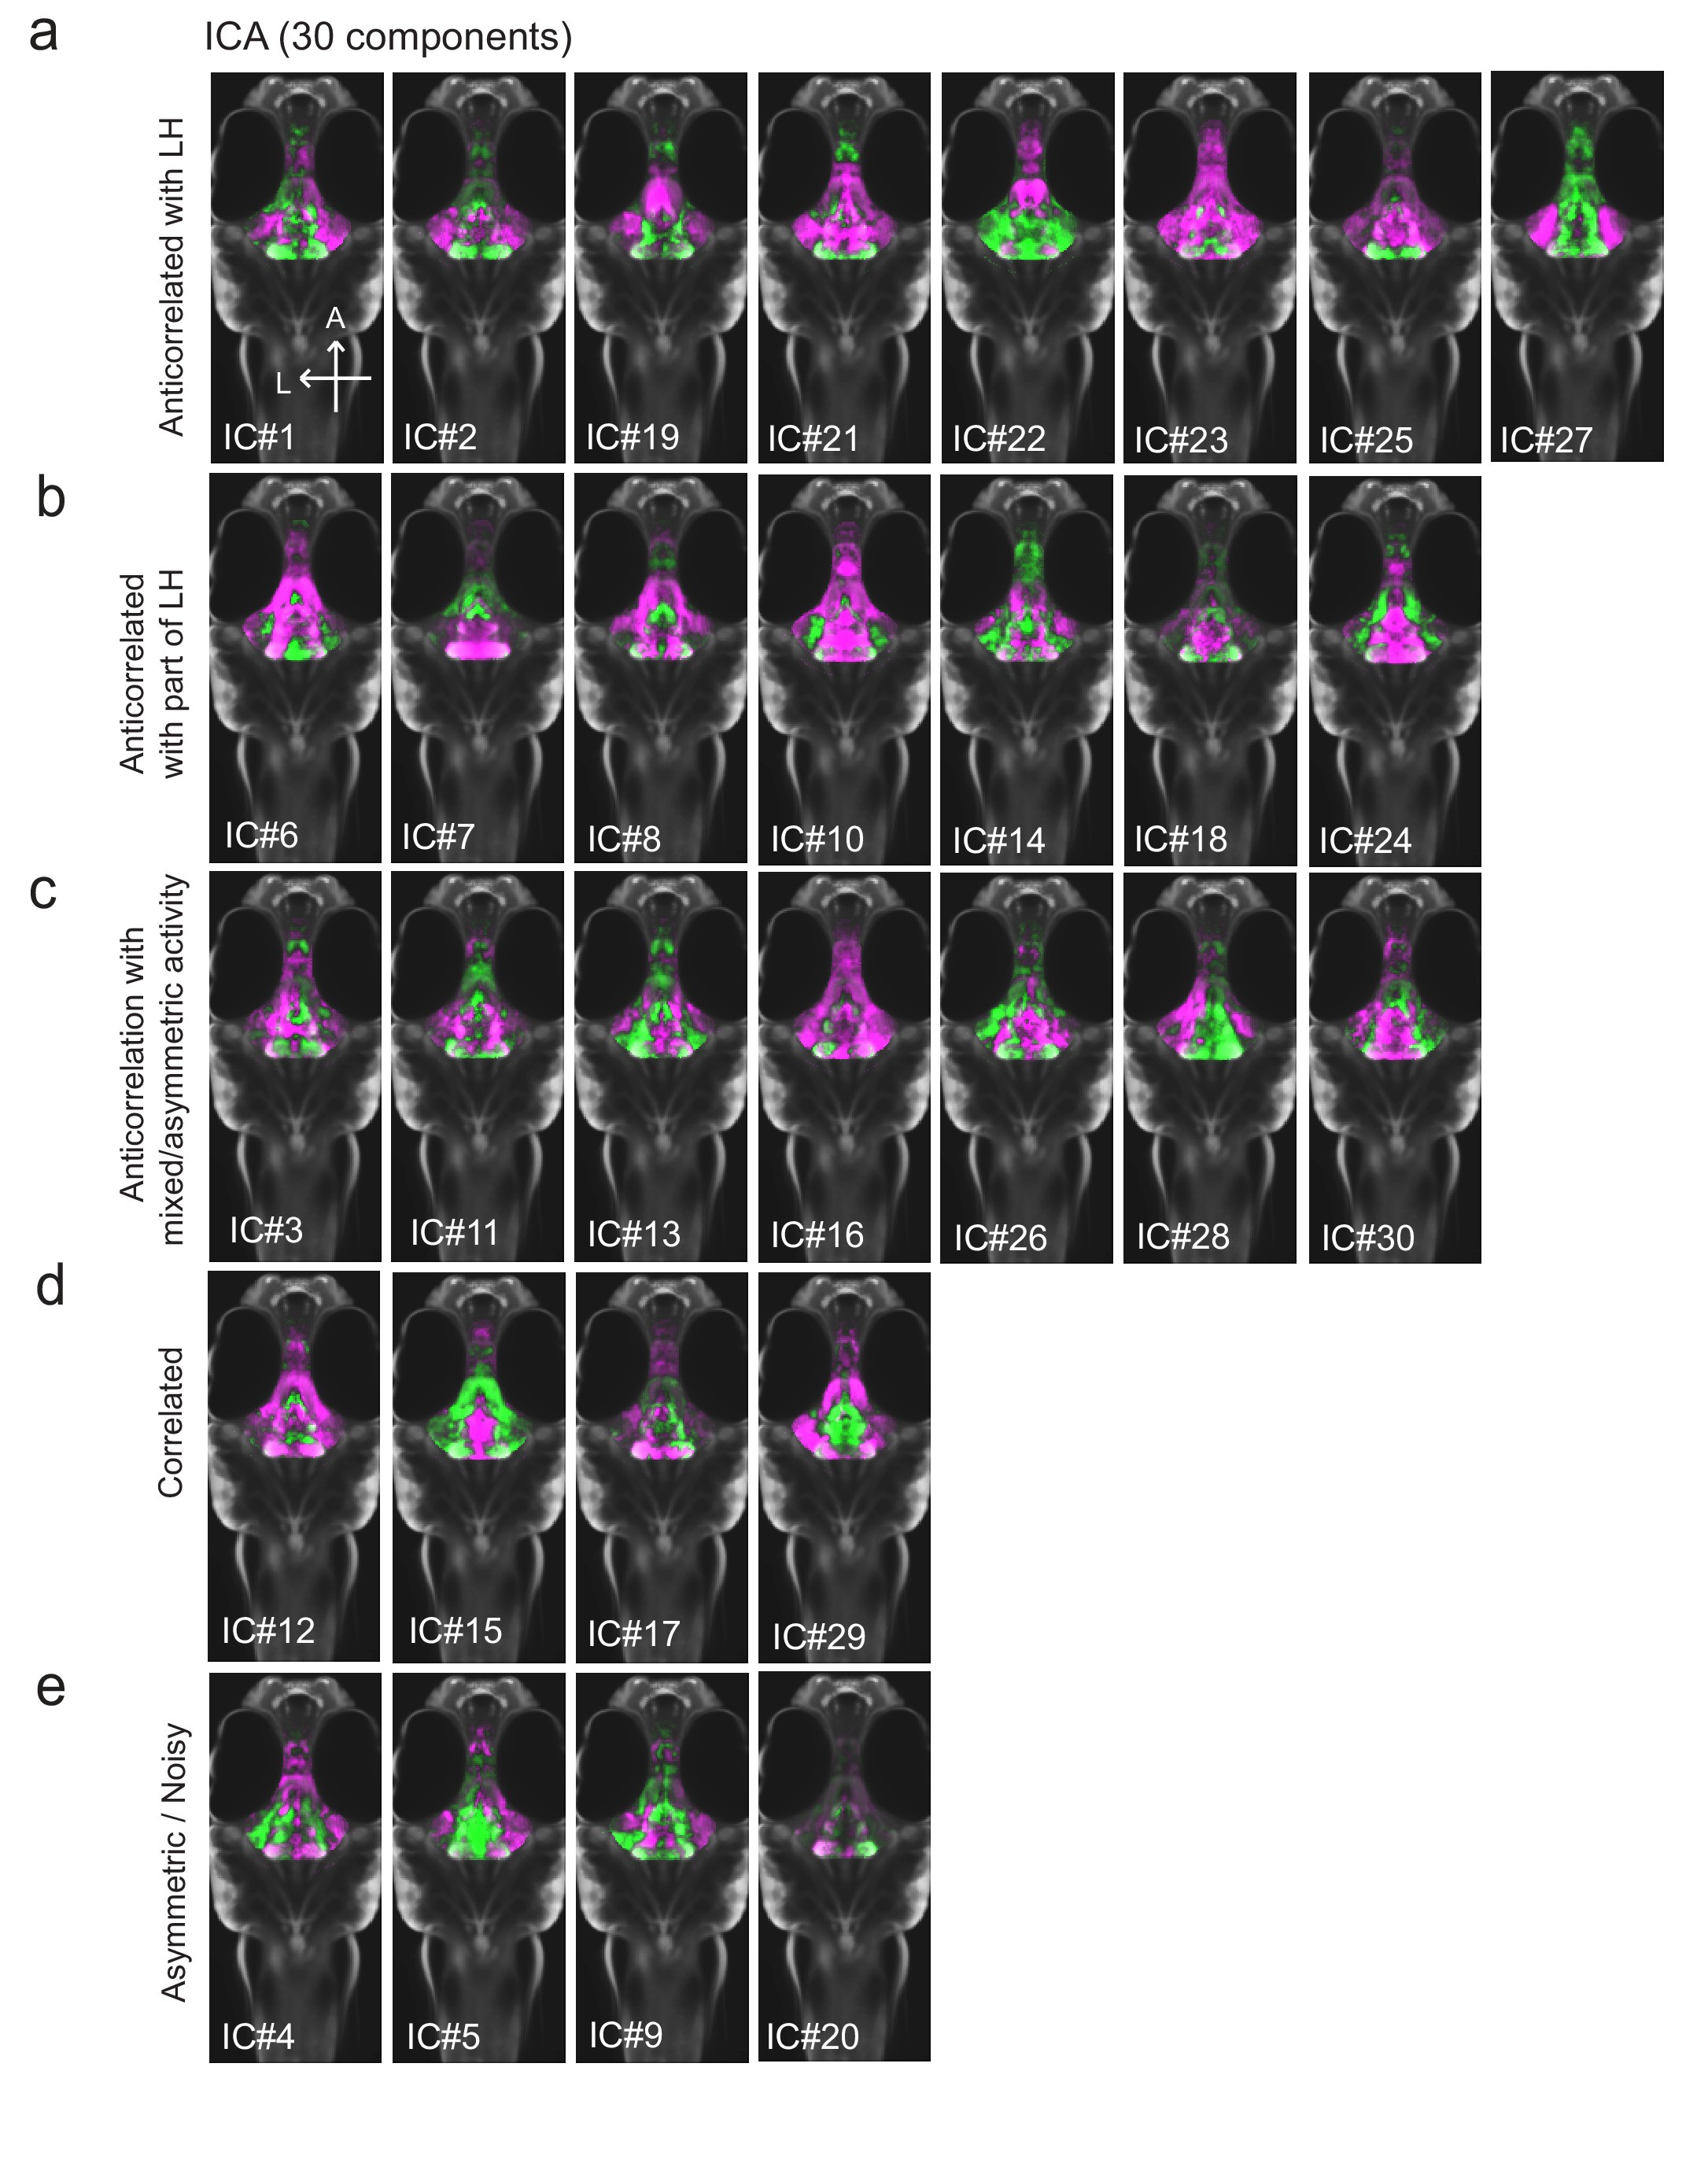
Fig. 1-S3
All 30 independent components extracted from ICA analysis.
This method separates pERK signals into statistically independent components based on their correlated and anti-correlated activities, thus identifying putative functional connectivity (both positive or negative relationships) between different brain regions ( Randlett et al., 2015; see Materials and methods). Fish included in this analysis were either food-deprived (2 hr), food-deprived and then fed for 15 min prior to harvest, or continuously fed (n = 300 fish total). ( a-c) From this analysis, multiple independent component networks (ICs) were identified in which at least part of the LH displayed an inverse activity relationship (i.e. opposite loadings) with the cH (22/30). ( d) 4/30 ICs had correlated LH and cH activity. However, in these cases lateral loci displayed some anti-correlated activity with medial loci (especially IC #15 and 29). ( e) There were 4/30 ICs that displayed asymmetrical or noisy activity patterns that rendered them unclassifiable.