
Image
|
Figure Caption
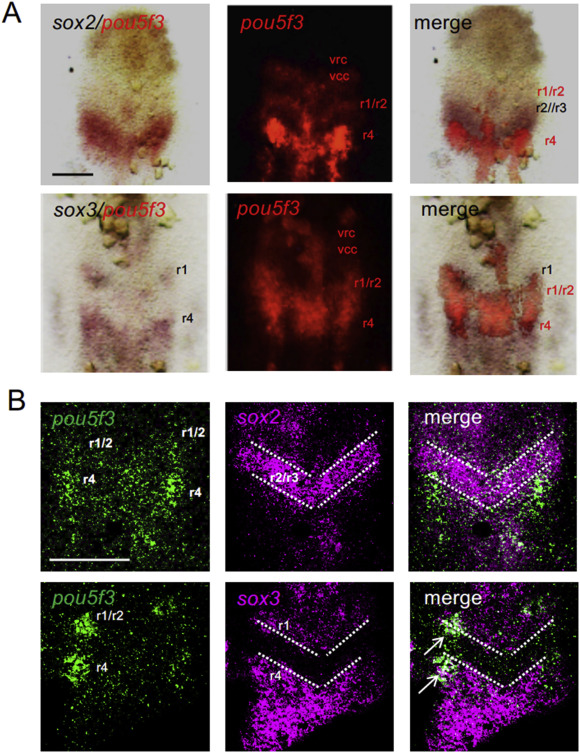
Fig. 4 Relationship between the expression regions of pou5f3 and soxB1. A. Expression of soxB1 (brown) and pou5f3 (red) was compared at the bud stage by two-color WISH. Bright-field views (left), epifluorescence views (middle), and merged views (right) are shown for each of the gene pairs examined. B. Expression of soxB1 (magenta) and pou5f3 (green) was compared at the bud stage by two-color FISH. White dotted lines show rhombomere boundaries. The right side of the hindbrain is out of focus in the bottom row due to tilted mounting. For abbreviations, see the legend for Fig. 1. Scale bars, 100 μm.
Figure Data
Acknowledgments
This image is the copyrighted work of the attributed author or publisher, and
ZFIN has permission only to display this image to its users.
Additional permissions should be obtained from the applicable author or publisher of the image.
Reprinted from Developmental Biology, 457(1), Inomata, C., Yuikawa, T., Nakayama-Sadakiyo, Y., Kobayashi, K., Ikeda, M., Chiba, M., Konishi, C., Ishioka, A., Tsuda, S., Yamasu, K., Involvement of an Oct4-related PouV gene, pou5f3/pou2, in neurogenesis in the early neural plate of zebrafish embryos, 30-42, Copyright (2019) with permission from Elsevier. Full text @ Dev. Biol.