
|
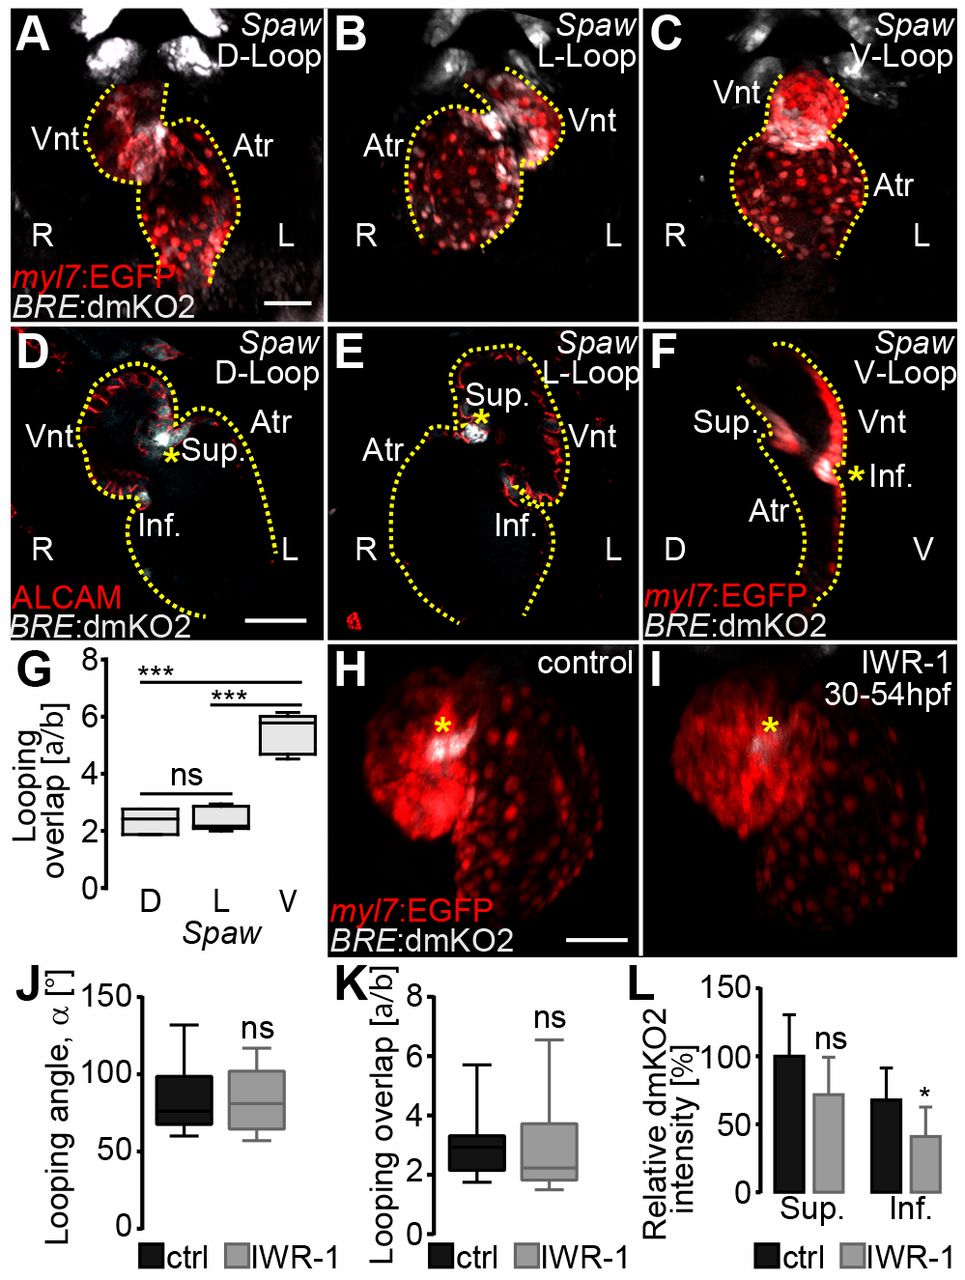
Fig. 4 Establishment of asymmetric Bmp signaling within the AVC is not dependent on Nodal or Wnt signaling. (A-C) Loss of the Nodal ligand Spaw results in D-looped (A), L-looped (B) or V-looped (C) hearts (D, L and V refer to the ventricular position with respect to embryonic body axes). (A-C) Reconstructions of confocal z-scans of representative 54 hpf spaw morphant hearts with expression of Bmp Tg(BRE:dmKO2)mw40 (false-colored gray) and myocardial Tg(mly7:EGFP)twu34 (false-colored red) reporter lines. Frontal view of hearts imaged on fixed embryos. R, right; L, left embryonic side. (D,E) Confocal z-stacks in the right-left (R-L) plane of representative D- (D) and L- (E) looped hearts with Bmp signaling activity, as indicated by Tg(BRE:dmKO2)mw40 and myocardial cell borders immunolabeled against ALCAM (false-colored red). Hearts looped within the R-L plane show Bmp activity in both chirality orientations within myocardial cells of the AVC (yellow asterisk). (F) Confocal z-stack image in the dorsal-ventral (D-V) plane of a V-looped heart with Bmp Tg(BRE:dmKO2)mw40 and myocardial Tg(mly7:EGFP)twu34 reporter lines. The outline of the heart is delineated by a yellow dotted line. Atr, atrium; Vnt, ventricle; Sup., superior AVC; Inf., inferior AVC. (G) Quantification of index a/b (data in Table S1). (H-L) The Wnt signaling pathway it is not involved in cardiac S-looping morphogenesis. (H,I) Reconstruction of confocal z-stacks of representative transgenic hearts with the Bmp reporter Tg(BRE:dmKO2)mw40 and myocardial reporter Tg(mly7:EGFP)twu34. 0.1% DMSO-treated (control) (H) or Wnt inhibitor IWR-1-treated (I) hearts show Bmp signaling within the myocardium (yellow asterisks). (J-L) Looping angle (α) (data in Table S1) (J), index a/b (data in Table S1) (K) and relative dmKO2 intensity (L) at the superior AVC are not significantly affected by IWR-1 treatment (data in Table S5). (L) The relative dmKO2 intensity at the inferior AVC is slightly reduced (P≤0.05) after IWR-1 treatment (statistical analysis in Table S5). In G,J,K, the limits of the boxes indicate the range between the first quartile (25th percentile) and the third quartile (75th percentile). The line inside box indicate the median value. The error bars indicate the maximum and minimum values. Data are mean±s.d. in L; ns, not significant; *P≤0.05, ***P≤0.001. Scale bars: 50 μm.