IMAGE

Figure 5

ID
ZDB-IMAGE-200314-32
Source
Figures for Sun et al., 2020
Image
Figure Caption

Figure 5

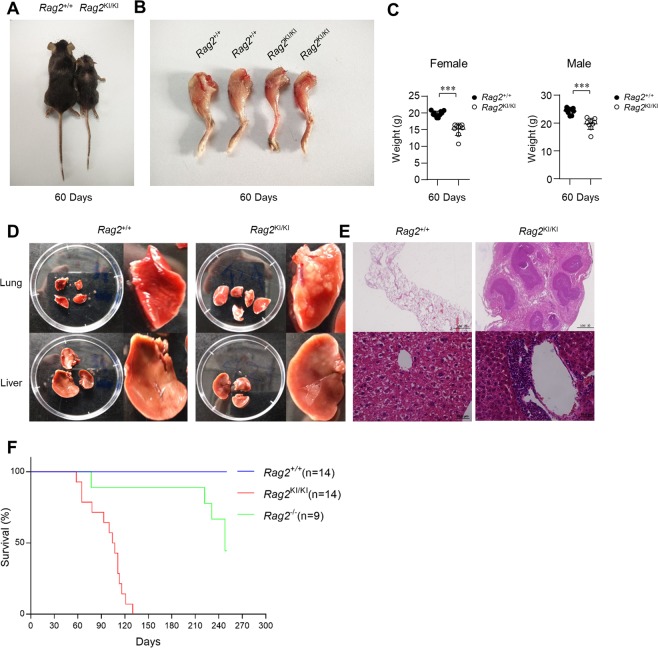
Rag2KI/KI mice develop severe cachexia syndromes. (A) Representative photographs of 2 months old Rag2KI/KI mice and wild-type Rag2+/+ littermates. (B) Skin was stripped from the hind limbs of 60 days old mice for gross comparisons of muscle mass. (C) Total body weight of 2 months old Rag2+/+ mice (n = 9) Rag2KI/KI mice (n = 9). (D) Representative photographs of lungs and livers from 2–5 months old Rag2KI/KI mice and wild-type Rag2+/+ littermates. (E) Representative H&E staining of lung and liver sections at 2–5 months old Rag2KI/KI mice and wild-type Rag2+/+ littermates. (F) Kaplan–Meier curves of Rag2+/+ mice, Rag2KI/KI mice and Rag2/ mice (Rag2+/+ mice, n = 14; Rag2KI/KI mice, n = 14; Rag2/ mice, n = 9). Chi square log-rank test was used for statistical analysis. The results are representative of three independent experiments. The error bars indicate the SDs. The data are presented as the mean ± standard deviation. *P < 0.05, **P < 0.01 and ***P < 0.001 by Student’s t test.

Acknowledgments
This image is the copyrighted work of the attributed author or publisher, and ZFIN has permission only to display this image to its users. Additional permissions should be obtained from the applicable author or publisher of the image. Full text @ Sci. Rep.