IMAGE

Figure 2

ID
ZDB-IMAGE-200314-29
Source
Figures for Sun et al., 2020
Image
Figure Caption

Figure 2

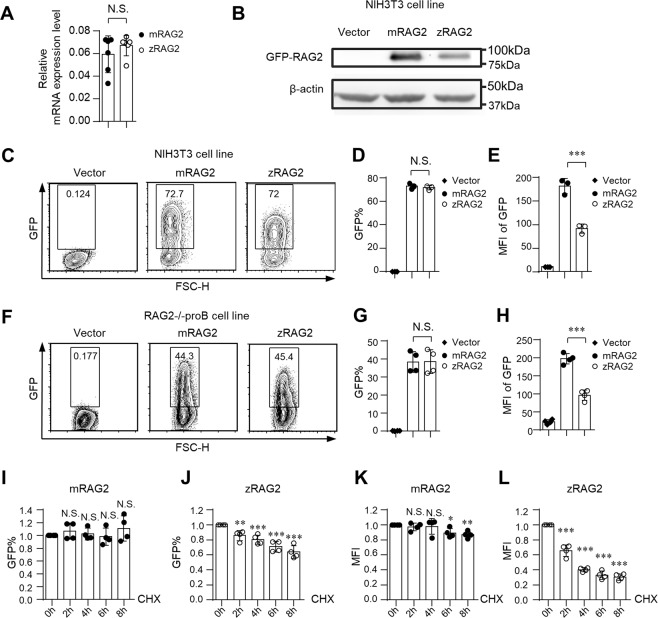
The zRAG2 protein is unstable compared to the mRAG2 protein at 37 °C. (A) Both zRAG2 and mRAG2 had the similar mRNA expression. The mRNA expression levels were normalized to β-actin expression. (B) The zRAG2 protein showed a lower expression level than the mRAG2 protein. β-actin served as a loading control for western blot analysis. (CE) and (FH) The zRAG2 protein showed an expression level similar to that of the mRAG2 protein, but its MFI was lower than that of mRAG2. zRAG2-GFP fusion protein and mRAG2-GFP fusion protein were introduced into NIH3T3 cells (CE) or RAG2-deficient pro-B cells (FH) by the retrovirus-mediated gene transfer method. After 36 h, GFP expression and intensity were analyzed by FACS. (IL) The zRAG2 level was sensitive to proteasome degradation. RAG2-deficient pro-B cells were treated with CHX for 8 hours. GFP intensity was analyzed by FACS. (I,J) The GFP% of mRAG2 and zRAG2 was shown; (K,L) The MFI of mRAG2 and zRAG2 was shown. The error bars indicate the SDs. The data are presented as the mean ± standard deviation. *P < 0.05, **P < 0.01 and ***P < 0.001 by Student’s t test; N.S.: no significance.

Acknowledgments
This image is the copyrighted work of the attributed author or publisher, and ZFIN has permission only to display this image to its users. Additional permissions should be obtained from the applicable author or publisher of the image. Full text @ Sci. Rep.