IMAGE

Figure 3

ID
ZDB-IMAGE-200314-22
Genes
Source
Figures for Grzegorski et al., 2020
Image
Figure Caption

Figure 3

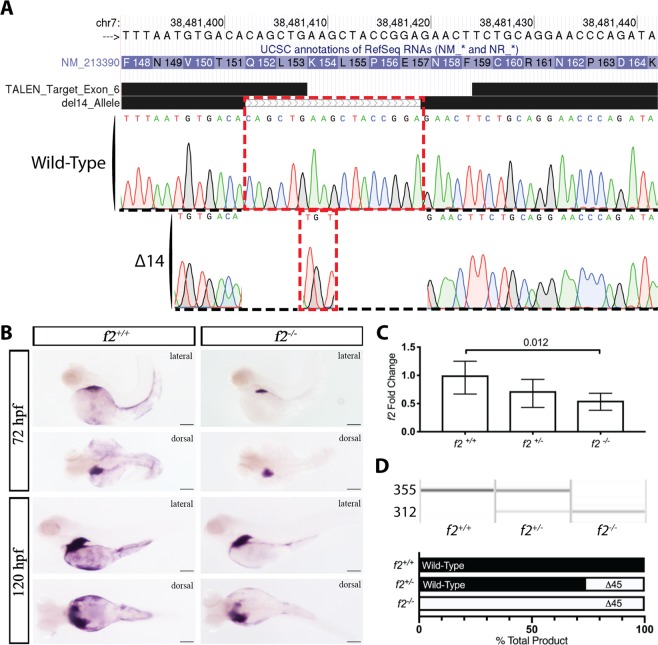
Genome editing creates a 14 bp genomic deletion with a resulting decrease in mRNA expression. (A) Alignment of Sanger sequencing with the chromosome 7 genomic region showed an overall 17 bp genomic deletion replaced with a 3 bp insertion; outlined in red, resulting in a net 14 bp deletion. (B) in situ hybridization demonstrated reduction of transcript at 72 and 120 hours post fertilization in homozygous mutants compared to control siblings. Spatial regulation remained intact with expression restricted primarily to the liver. (C) qPCR data of f2 expression reveals significant decrease of 45% in the homozygous mutant embryos. (D) Semi-quantitative RT-PCR of embryos shows a mutant band ~30 bp smaller than expected (later shown to be a 45 bp deletion, Fig. 4). Quantitation of the bands reveal that the mutant band is only 26% of the total in heterozygotes.

Figure Data
Acknowledgments
This image is the copyrighted work of the attributed author or publisher, and ZFIN has permission only to display this image to its users. Additional permissions should be obtained from the applicable author or publisher of the image. Full text @ Sci. Rep.