IMAGE

Figure 1

ID
ZDB-IMAGE-200311-16
Source
Figures for Pringle et al., 2019
Image
Figure Caption

Figure 1

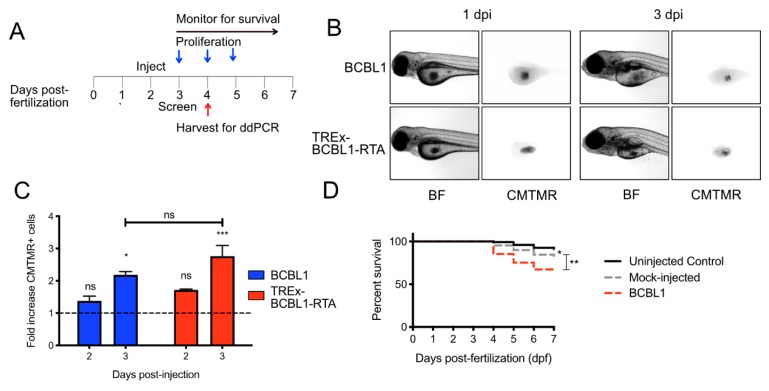
Proliferation of BCBL and TREx-BCBL1-RTA in zebrafish larvae: (A) timeline of xenotransplantation experiment. Fish were xenotransplanted with fluorescent CMTMR-labeled, primary effusion lymphoma cells by microinjection at 2 days post-fertilization (dpf). The following day, embryos were visually screened with a fluorescent microscope for viability and the presence of a cell bolus in the yolk sac. Groups of larvae were sacrificed at indicated times for dissociation and counting of xenotransplanted cells or RNA harvest. Survival of the larvae was monitored throughout the experiment; (B) photomicrographs of xenotransplanted larvae demonstrating the bolus of cells in the yolk sac at 1 and 3 days post-injection (dpi), which are 3 and 5 dpf, respectively; (C) proliferation of BCBL1 and TREx-BCBL1-RTA cells at 2 and 3 dpi normalized to the number of cells counted at 1 dpi (n = 3 independent experiments with cells from 20 larvae counted per measurement; means ± SEM; statistical significance was determined by two-way ANOVA compared to the cell counts at 1 dpf); (D) CMTMR-labeled BCBL1 cells were injected into 2 dpf embryos, which were screened at 3 dpi. Then survival was monitored until 7 dpf. Uninjected and media mock-injected embryos were included as controls (n = 150 larvae per group accrued from 3 separate hatchings; statistical significance was determined by Mantel-Cox test; * = p < 0.05, ** = p < 0.01, *** = p < 0.001).

Acknowledgments
This image is the copyrighted work of the attributed author or publisher, and ZFIN has permission only to display this image to its users. Additional permissions should be obtained from the applicable author or publisher of the image. Full text @ Viruses