IMAGE

Figure 1

ID
ZDB-IMAGE-200310-42
Genes
Source
Figures for Leinonen et al., 2019
Image
Figure Caption

Figure 1

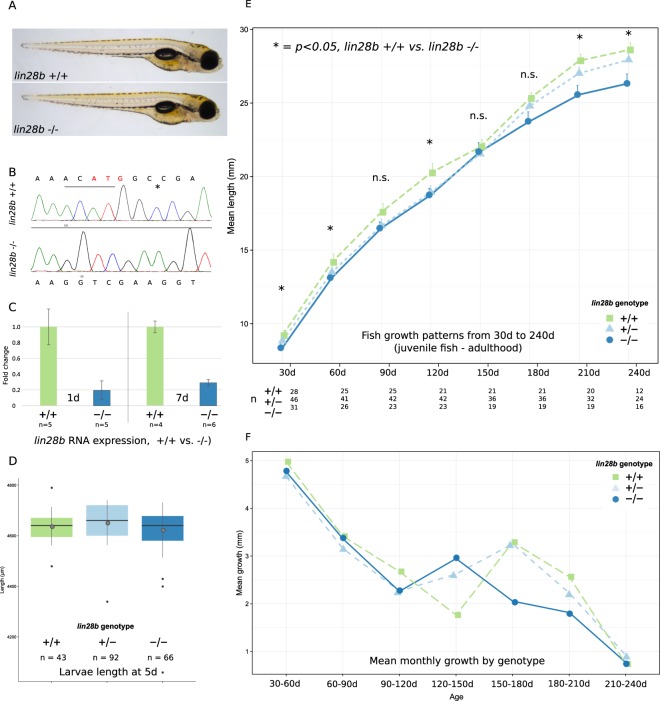
Characteristics and growth patterns of the lin28b KO fish. (A) Images of 5d old lin28b control (+/+) and KO (−/−) larvae (B) Sequencing traces showing the four deleted bases (underlined) + one mismatch (asterisk) in exon1 mutant fish. The bases deleted in the mutants overlap the translation initiation codon for lin28b (in red). (C) Full length lin28b mRNA expression in control vs lin28b KO RNA-Seq samples at 1d and 7d. The expression of lin28b RNA appears downregulated in the KO fish, likely due to NMD related mechanisms. (D) Comparison of the lin28b KO and the control zebrafish size at 5d. No significant size differences were observed at this stage (One-Way-ANOVA with post-hoc Tukey HSD, Error bars = SEM). (E) Growth curves for the lin28b KO and the control fish. The growth of the KO fish was reduced, but the size difference temporarily vanishedaround the time of sexual maturation (One-Way-ANOVA with post-hoc Tukey HSD, Error bars = SEM, *P < 0.05). (F) Mean monthly growth by genotype. Around the period when the fish undergo sexual maturation the growth rate peaks transiently. The lin28b KO fish seem to undergo this transient peak in growth earlier than controls.

Figure Data
Acknowledgments
This image is the copyrighted work of the attributed author or publisher, and ZFIN has permission only to display this image to its users. Additional permissions should be obtained from the applicable author or publisher of the image. Full text @ Sci. Rep.